
Have you ever heard anyone mention the yield curve and wondered what on earth they were talking about? It’s really not as complicated as it sounds. More importantly, you can make better financial and investment decisions if you have a basic grasp of what the yield curve is and what it might be telling us. There are 3 main things you need to know about the yield curve:
1. What Is It?
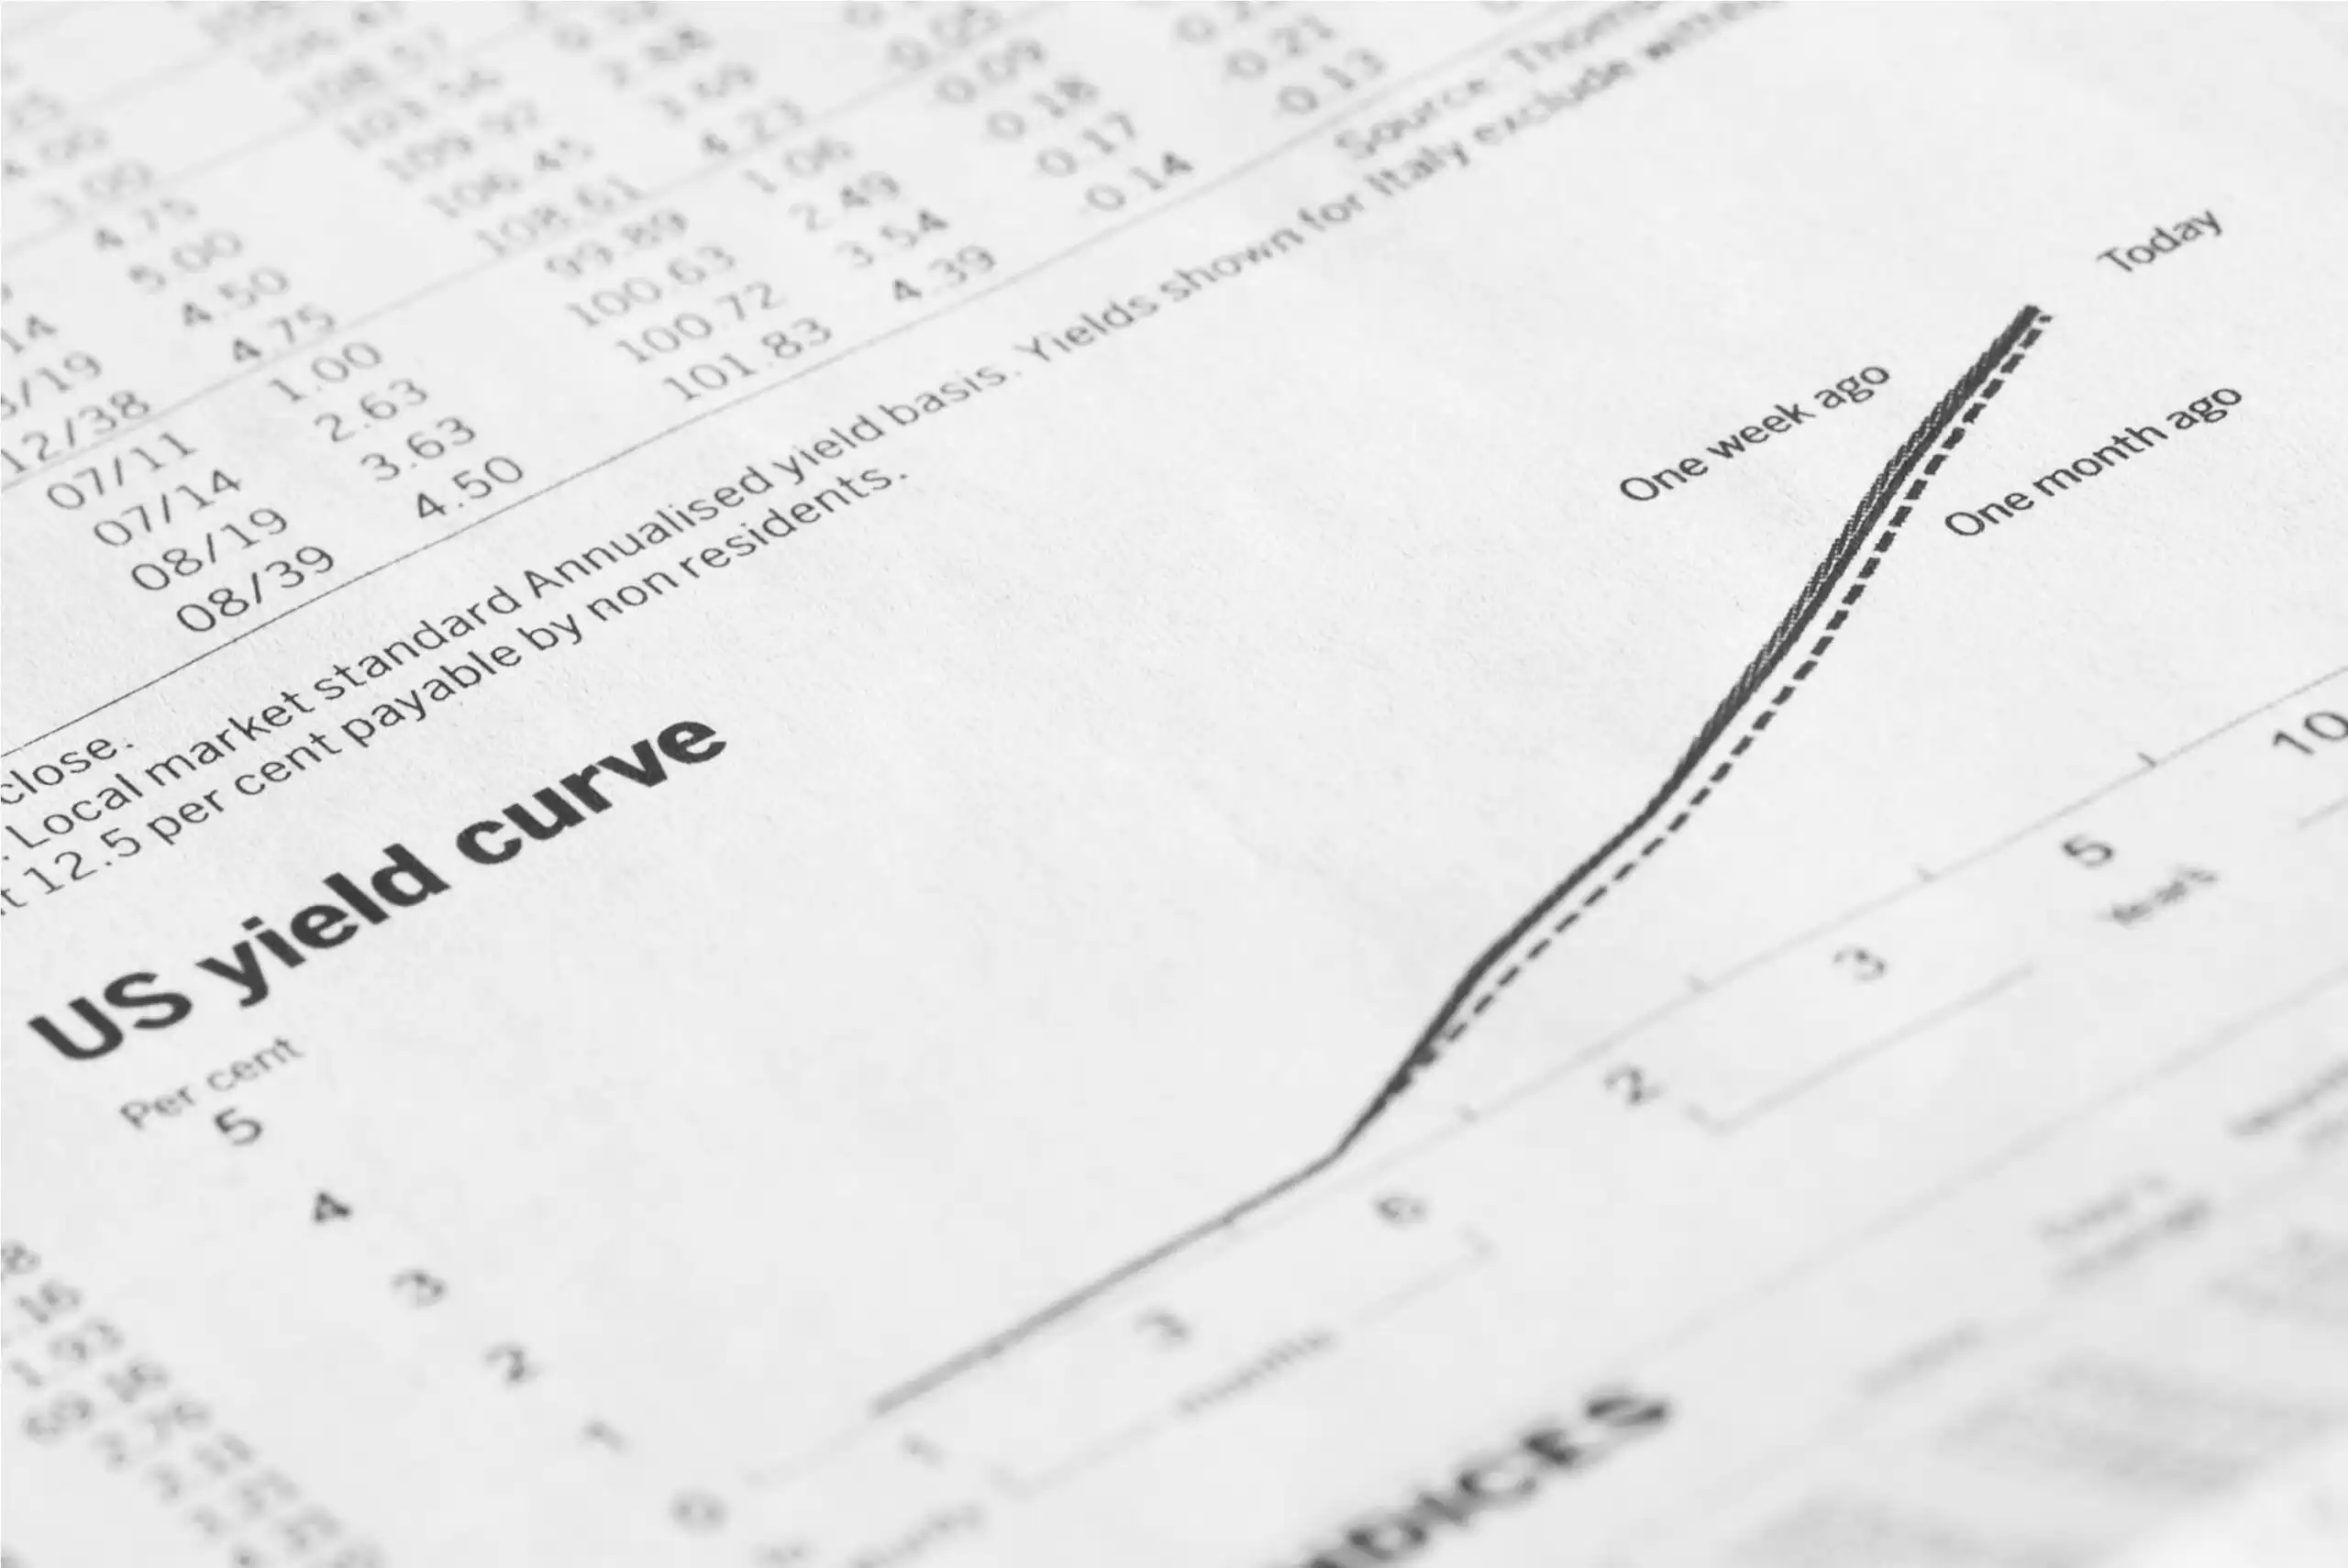
The yield curve is simply a graph of what benchmark bonds such as U.S. government bonds are yielding across different maturities. The image above shows what the U.S. Treasury yield curve looked like around October 12, 2010. You can see that shorter-term bonds were yielding less than longer-term bonds, while interest rates are historically low across the curve. In general, lower interest rates are associated with slower economic activity or deflation, and higher rates go with economic expansion or inflation. In this sense, the connection is validated by the fact that economy was in a recession during the time this graph was published.
2. What Shape Is It?
The shape of the yield curve can tell us about what bond investors are predicting about the economy and the future direction of interest rates. Generally, the Federal Reserve has more control over interest rates at the short end of the curve, whereas bond traders have a little more say on longer-term yields. The yield curve can take on a variety of shapes, each of which may send a different message to investors:
- Normal Curve: Normally, long-term bonds carry higher yields than short-term bonds.The reason is that the buyer is basically being paid a little extra by the issuer because the issuer is able to keep the investor’s money for a longer period of time. So a normal yield curve generally slopes upward from the lower left to the upper right, as is the case today. For example, with a normal yield curve, the yield on a 2-year bond is lower than the yield on a 10-year bond.
- Flat Curve: When the yield curve is flat, that means interest rates are similar across various maturities. There is no premium for putting your money to work for longer periods of time. This type of curve usually signals uncertainty over the future direction of the economy and can be a precursor to an inverted yield curve.
- Inverted Curve: The yield curve is inverted when short-term rates are higher than long-term rates. Many economists and investors see this as a very powerful harbinger of a recession. Indeed, the yield curve flattened early in 2006 and became inverted by the end of the year and into 2007, just as the stock market peaked and the worst recession since the Great Depression began. The reason long-term yields are lower is because investors are very negative on the future economy, and want to lock in long-term, safe investments while they still can. As a result, the high demand pushes the long-term rates down.
- Humped Curve: This type of curve occurs when yields in the middle of the curve are higher than those at both the short and long end of the curve. This condition is extremely rare, but anytime longer-term yields are lower, that can be a sign of slowing economic activity.
3. How Steep Is It?
The steepness of the yield curve is a measure of the spread, or difference, between short and long-term yields. Historically the spread between 3-month Treasuries and 20-year Treasuries averages about 2 percentage points. The yield curve usually becomes steeper after a recession or when the economy is at the beginning of an economic expansion.
A steeper normal yield curve is good for financial institutions since they tend to borrow short-term money in order to lend long-term money. They may be paying you 1% to keep your money in a savings account at their bank, but charge you 4% – 6% for your long-term mortgage. It’s a pretty good profit scenario for banks, especially considering their other high-interest lending options. For example, banks can charge into the 20% range for credit card loans. Thus, when the yield curve steepens, it might be a good time to invest in financial services stocks.
Even though it seems like only banks benefit form a steep yield curve, the whole economy actually does. Because financial institutions are so much more willing to lend out money in this kind of environment, it provides the funds necessary for small businesses, homeowners, investors, and anyone else who needs access to funds. There is a huge, positive, trickle-down effect. The opposite scenario is what happened in 2008 and 2009 when the loan markets “dried up,” and no one could initiate any new projects or investments, or take out the necessary loans to keep their businesses going.
Why Does the Yield Curve Matter?
It’s not necessary for the average consumer or investor to follow every bump and wiggle in the yield curve. It’s more important to have a rough idea of the shape and steepness of the yield curve, and to take note when significant changes in either of these parameters occur. A flattening yield curve could be a precursor to an inverted yield curve. That might tell you that it’s time to be a little more cautious with your spending and investments, as a global economic recession could be in the cards.
You can also look at the Treasury yield curve as a benchmark for other interest rates such as those you might receive from a CD or bond with a comparable duration. If you’re interested in learning more, StockCharts has an excellent Dynamic Yield Curve tool that tracks the current and historical shape of the yield curve relative to the performance of the S&P 500. You can chart the changes in the yield curve over the past 8 years or so and see the related changes in the stock market. The correlation can often be pretty remarkable.
Editorial & Advertiser Disclosure: The editorial content on this website is not provided, commissioned, reviewed, approved, or otherwise endorsed by any advertiser. Opinions expressed are ours alone, not those of any advertiser. The offers that appear are from companies from which we may receive compensation. However, this compensation does not impact where and how these companies are mentioned on the site. We do not include all companies or all available offers in the marketplace.
Related: