

One of the biggest influences on Americans’ success is debt. Too much will put you on the path to bankruptcy, while not enough will limit your ability to buy and borrow a home, vehicle, or any other major purchase. Striking the right combination of good and bad debt and balancing it against your income and assets is a skill that takes years to perfect.
Just as debt determines individual success, state and national debt patterns also influence how decisions are made by economists, investors, politicians, and business leaders all over the world. We’ve curated a selection of key debt statistics everyone should know.
Debt Statistics At a Glance
These figures take a birds-eye approach to the United States’ debt picture, offering a wider perspective on how Americans are managing their finances.
- American consumer debt totaled $14.27 trillion in Q2 of 2020.1
- Overall consumer debt dropped from a record $14.3 trillion in Q1 to $14.27 trillion in Q2 of 2020, the first drop since 2014.1
- At $9.78 trillion, mortgages make up nearly 70% of American household debt. The next highest debt category is student loans at $1.54 trillion, followed by auto loans at $1.34 trillion.1
- Approximately 3.5% of all American household debt is in delinquent status.1
- Overall debt is highest in the 40-49 age group at $3.57 trillion and lowest in the 18-29 age group at $.94 trillion.1
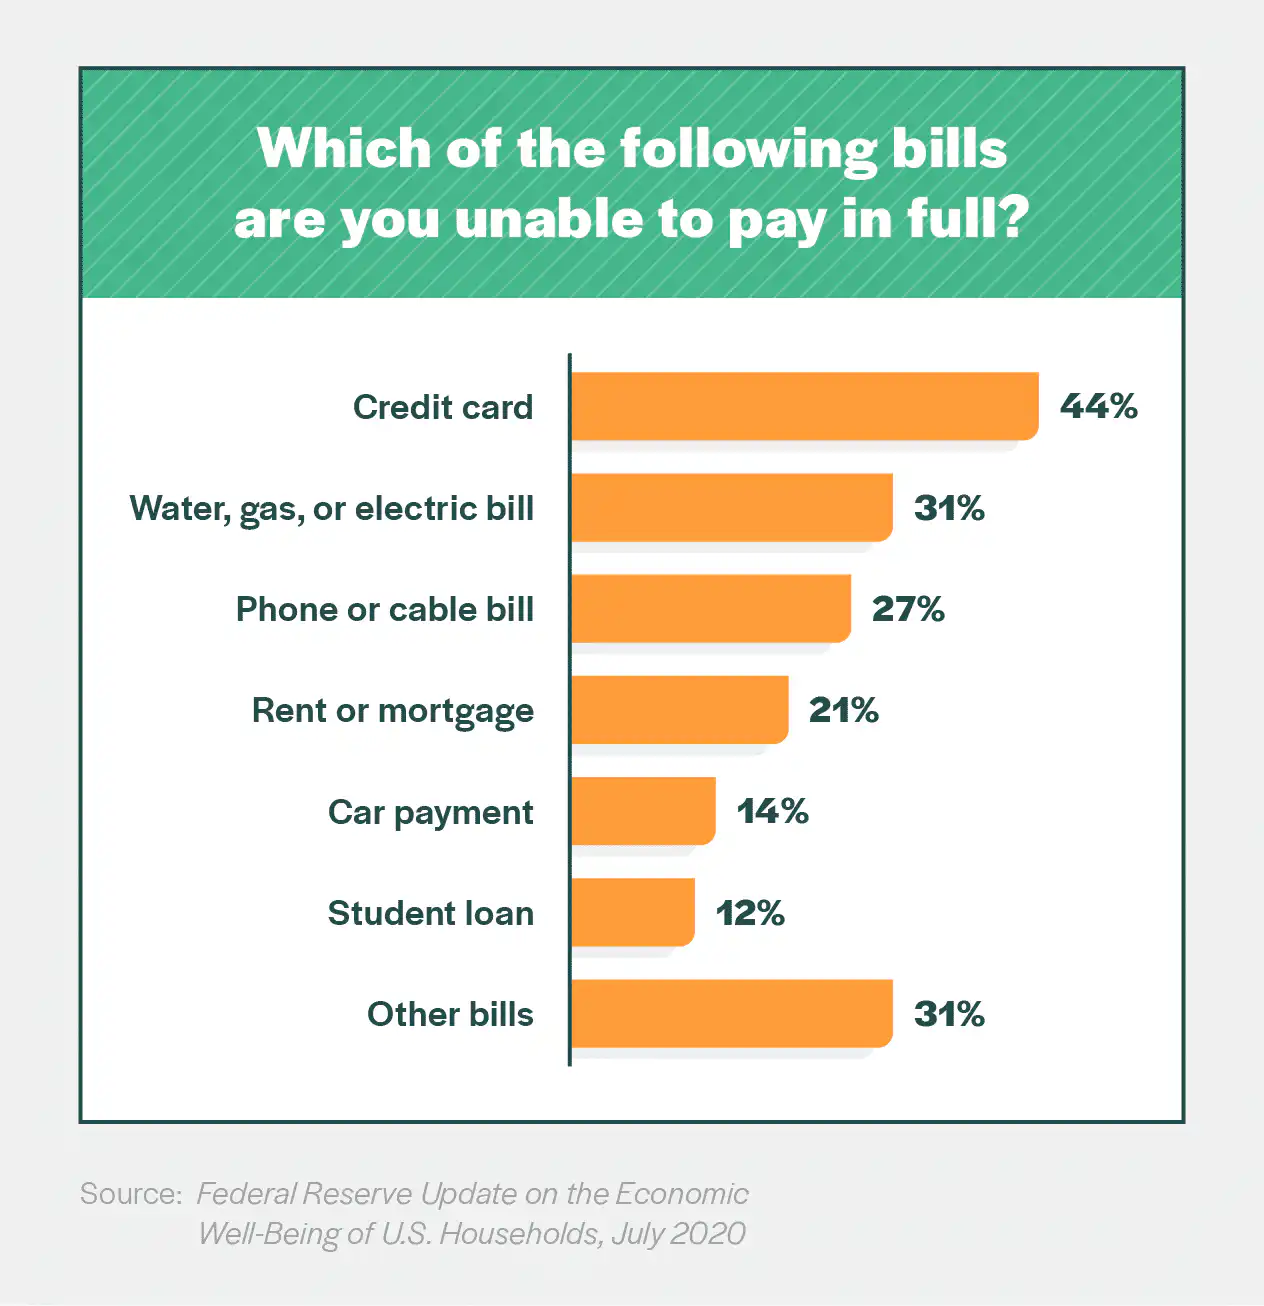
- In July 2020, nearly half (46%) of respondents to a Federal Reserve Survey said they would be able to pay a $400 emergency expense with the money currently in their bank account, while another 38% said they would be able to put it on a credit card and pay it in full at the next statement.2
- Additionally, 37% reported they were “living comfortably,” 40% said they were “doing okay,” 17% said they were “just getting by,” and 6% said they were “finding it difficult to get by.”2
Credit Card Debt Statistics
Credit card debt dipped slightly in 2020 as the impact of COVID-19 led to less consumer spending among households.
- The average credit card debt in 2020 was $1,624.60 per account1 and $6,124 per household.3
- Overall credit card debt in 2020 was $820 billion, down about $50 billion from 2019.1
- Americans in the 50-59 age group hold the most credit card debt at $200 billion, while those ages 18-29 hold the least at $50 billion.1
- The average FICO score in the United states is 703.4
- About 6 in 10 Americans have a FICO score of at least 700, while 1.2% of Americans have a perfect FICO score of 850.4
- Minnesota has the highest average state-wide credit score at 733. Mississippi has the lowest average FICO score at 667.4
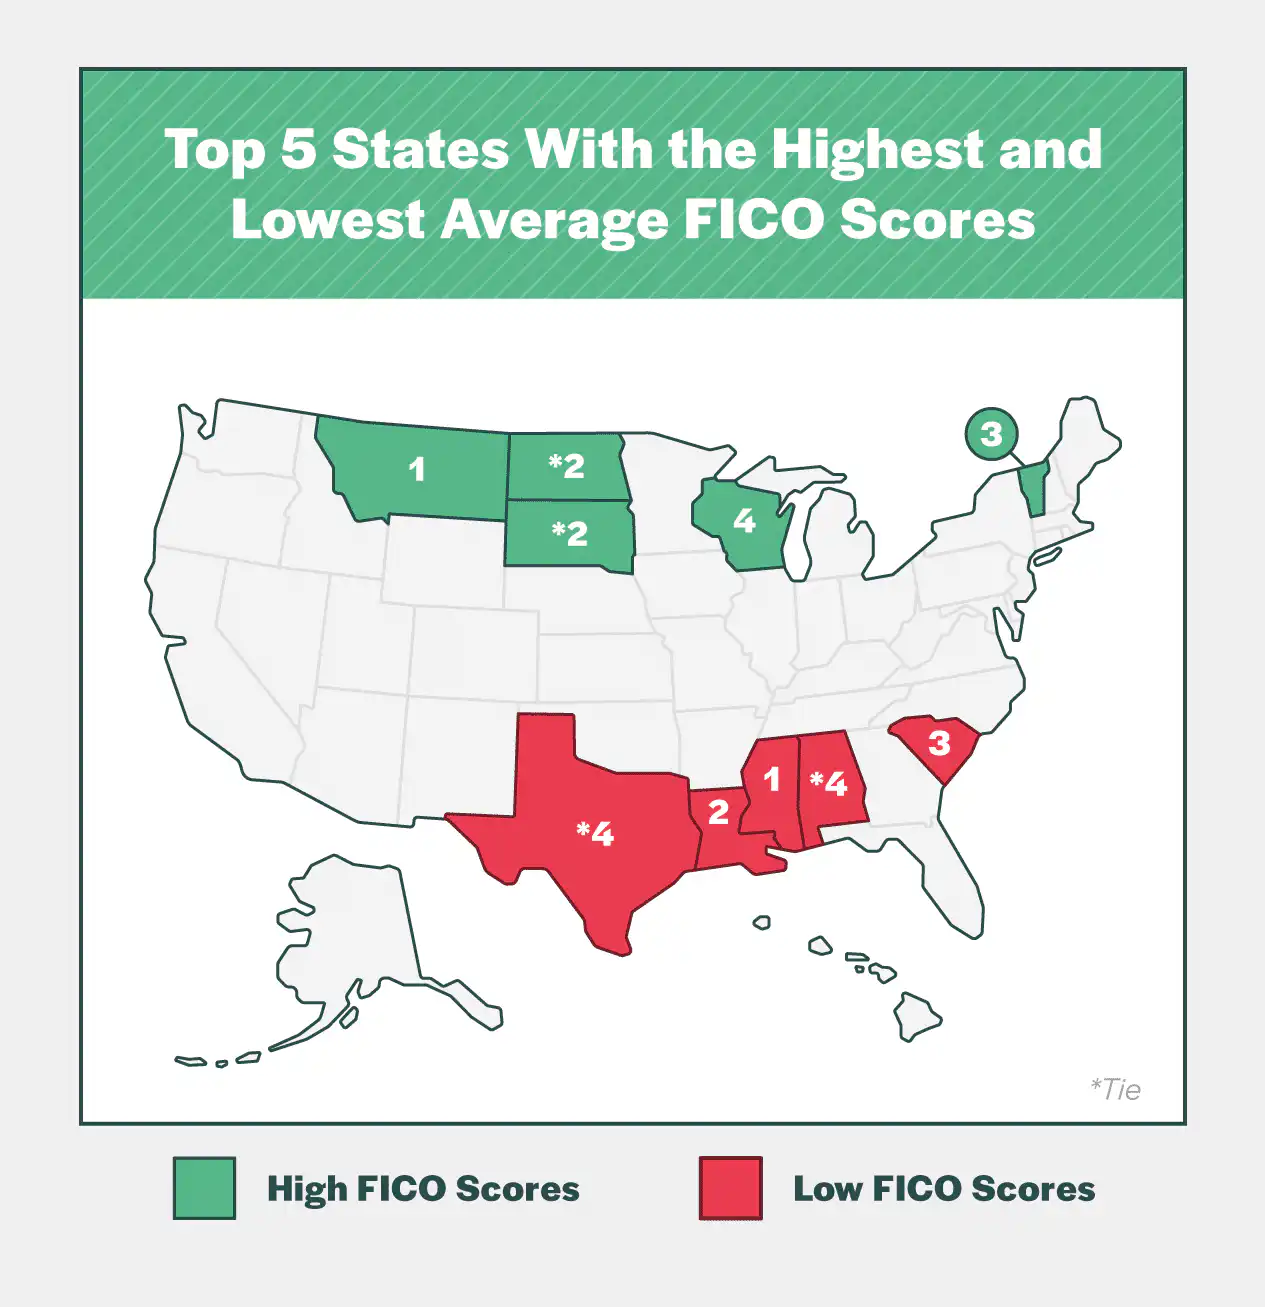
| States With the Highest and Lowest Average FICO Scores | |||
| 1. Minnesota | 733 | 1. Mississippi | 667 |
| 2. North & South Dakota (tied) | 727 | 2. Louisiana | 677 |
| 4. Vermont | 726 | 3. South Carolina | 681 |
| 5. Wisconsin | 725 | 4. Texas & Alabama (tied) | 680 |
Source: Experian 2019 Consumer Credit Review
Mortgage Debt Statistics
Historically, mortgage debt makes up the vast majority of debt among American consumers, and 2020 is no different.
- The average mortgage debt was $121,084.56 in Q2 of 2020.1
- Mortgage debt totaled $9.78 billion in Q2 of 2020, up $370 billion from Q2 2019.1
- Thanks to forbearance provisions included in the CARES Act, only about 24,000 mortgages entered foreclosure in Q2 of 2020. This is the lowest number of any quarter since 2003 (when the Federal Reserve began collecting this type of data) by tens of thousands. Prior to 2020, the lowest number of foreclosures in a single quarter was 64,360 in Q3 of 2018.1
- Mortgages make up the clear majority of debt in every age category except 18-29, where borrowers carry about the same amount of debt in mortgages and in student loans at approximately $350 billion each.1
- Borrowers ages 40-49 carry the most mortgage debt ($2.58 trillion), while those ages 18-29 carry the least ($350 billion).1
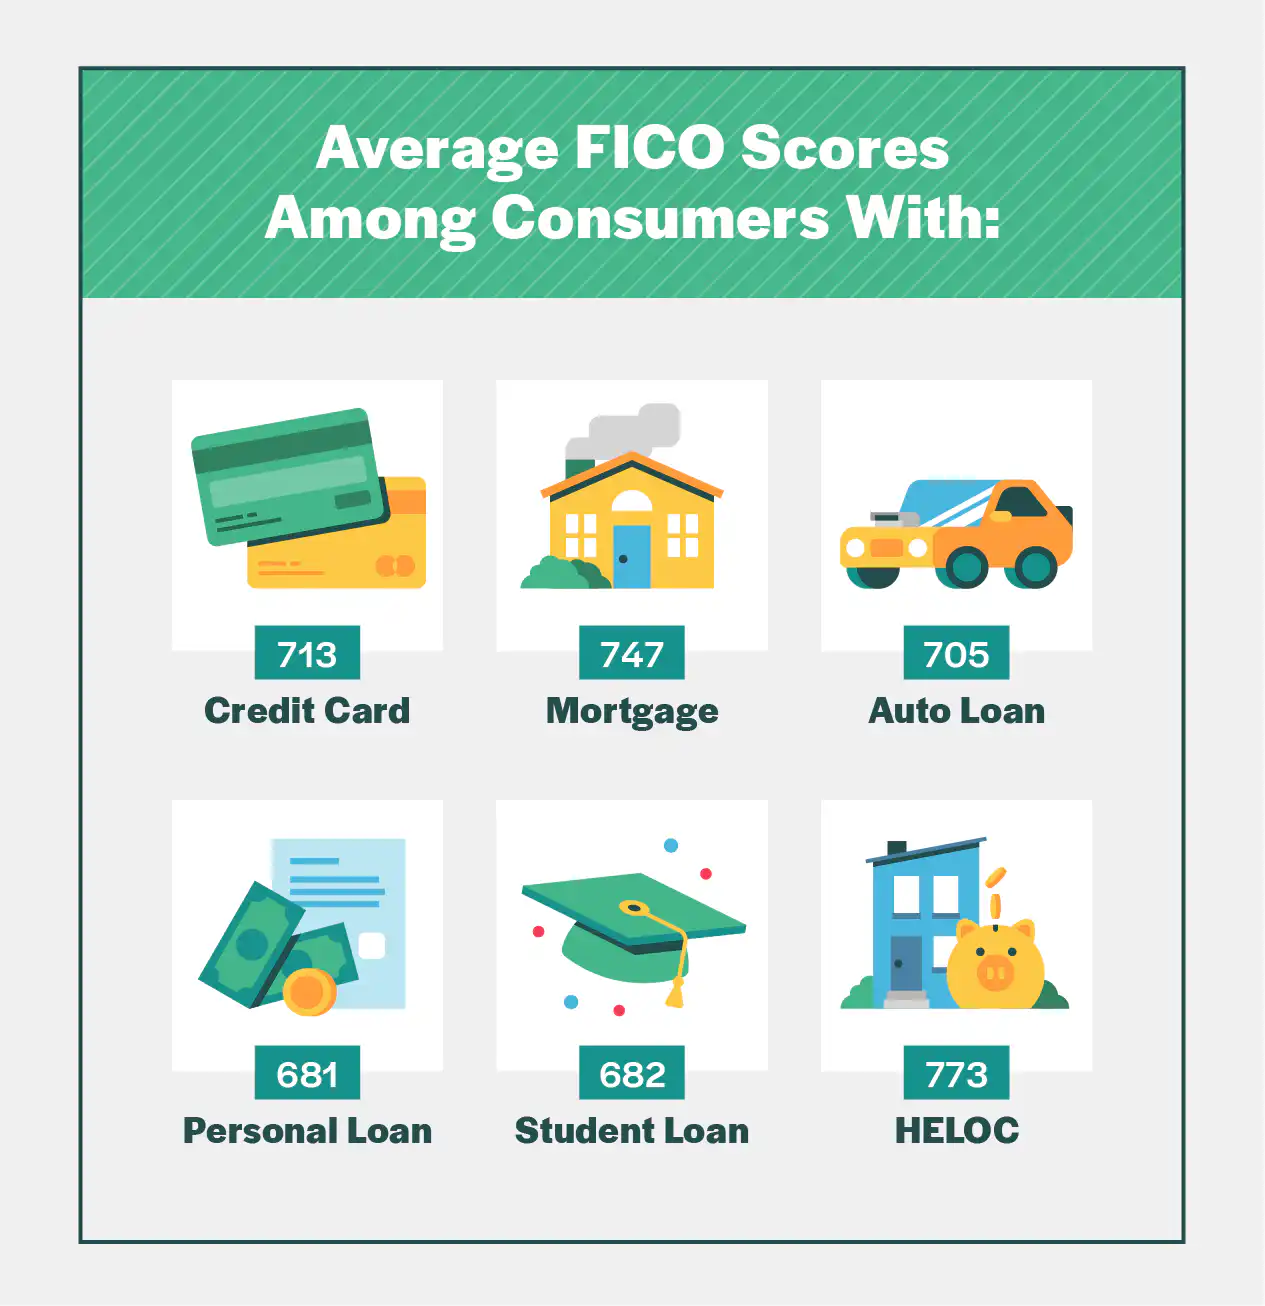
- The average FICO score among consumers with mortgages is 747.5
| Average Consumer Debt by FICO Score Range | |||||||
| Credit Card | Retail Card | Auto Loan | Personal Loan | Student Loan | Mortgage | HELOC | |
| 300-579
(Very poor) | $3,446 | $1,588 | $16,435 | $6,787 | $32,690 | $147,227 | $58,633 |
| 580-669
(Fair) | $6,489 | $1,820 | $19,811 | $10,187 | $36,264 | $163,986 | $55,227 |
| 670-739
(Good) | $9,712 | $1,730 | $21,003 | $17,333 | $36,948 | $202,176 | $58,252 |
| 740-799
(Very good) | $6,051 | $845 | $19,690 | $23,951 | $37,851 | $216,724 | $49,026 |
| 800-850
(Exceptional) | $3,616 | $370 | $18,011 | $28,864 | $32,308 | $213,315 | $36,470 |
Source: Experian 2019 Consumer Debt Study
Student Loan Debt Statistics
The cumulative federal student loan debt in the U.S. hit an all-time high of $1.54 trillion at the beginning of 2020 and remained consistent throughout Q1 and Q2 of that year.
- Total federal student loan debt in Q2 of 2020 was $1.54 trillion, the same amount as the previous quarter and up $20 billion from Q2 of 2019.1
- Over 62% of graduates in the class of 2019 had student loans, the value of which averaged $28,950 per graduate.6
- New Hampshire had the highest statewide average student debt among the class of 2019 at $39,410 per student. Utah had the lowest statewide average at $17,935 per student.6
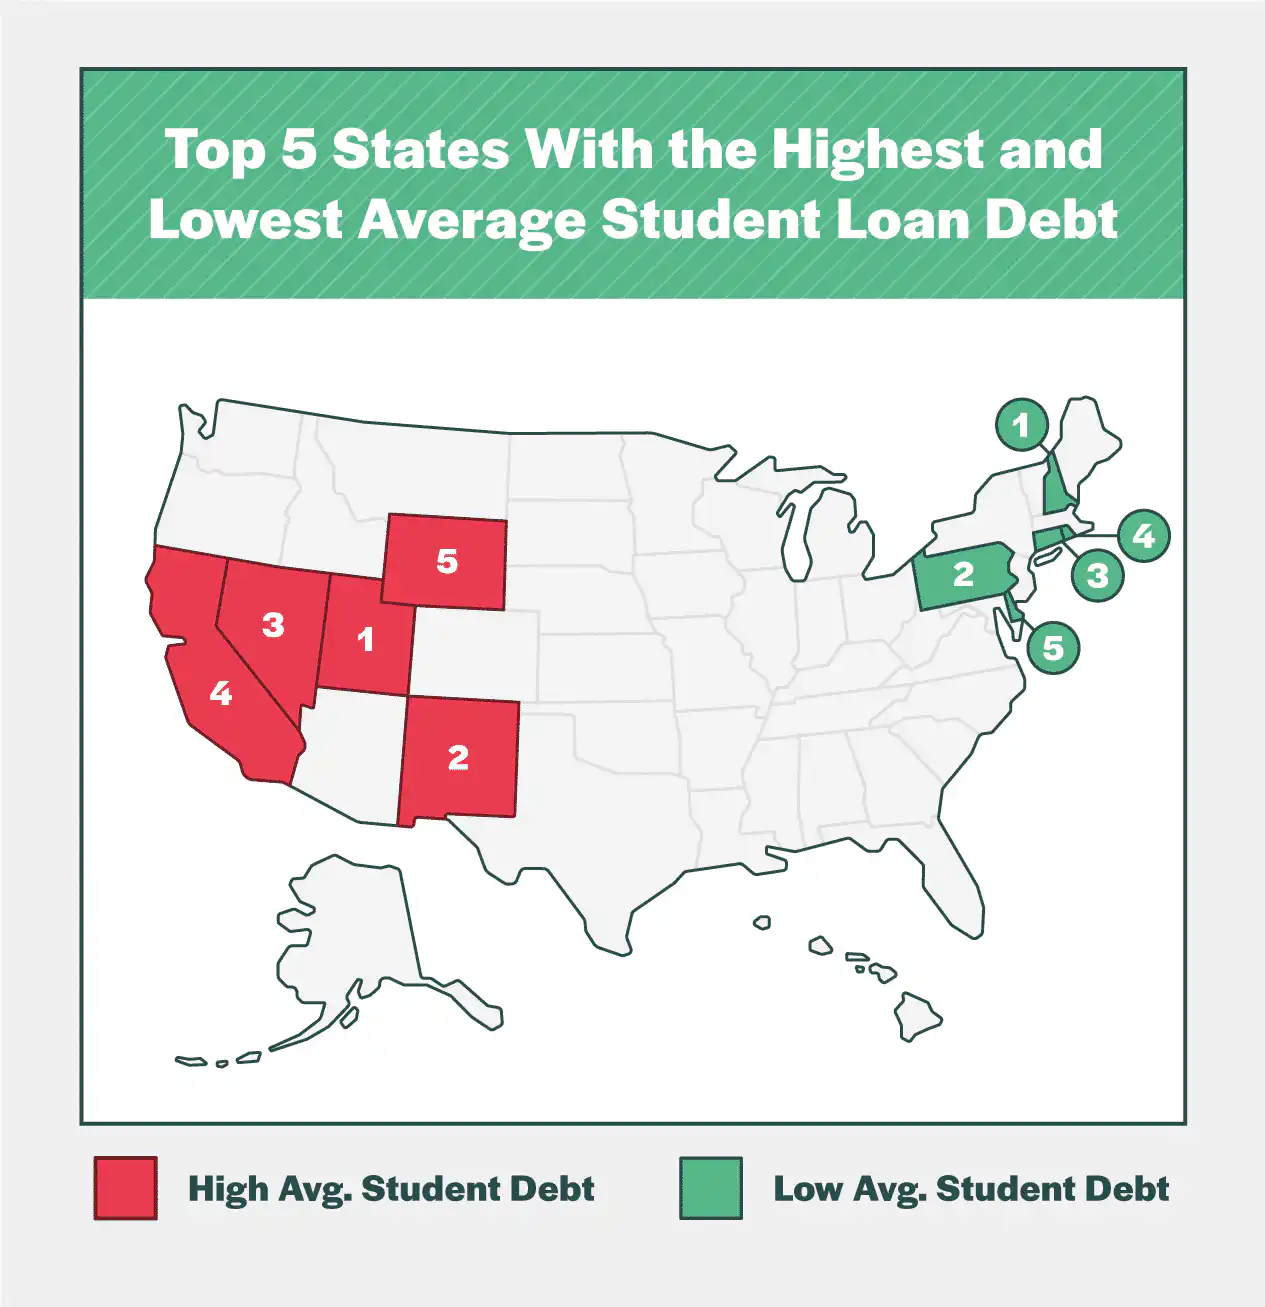
| States With the Highest and Lowest Average Student Loan Debt | |||
| 1. New Hampshire | $39,410 | 1. Utah | $17,935 |
| 2. Pennsylvania | $39,027 | 2. New Mexico | $20,991 |
| 3. Connecticut | $38,546 | 3. Nevada | $21,254 |
| 4. Rhode Island | $37,614 | 4. California | $21,485 |
| 5. Delaware | $37,447 | 5. Wyoming | $23,444 |
Source: Student Debt and the Class of 2019, The Institute for College Access and Success
Auto Loan Debt Statistics
Americans’ auto loan debt depends heavily on the state of their overall financial health. Rates and term lengths vary significantly depending on credit score and whether you’re buying new or used.
- The average auto loan debt in Q2 of 2020 was $11,679.60.1
- Total auto loan debt was $1.34 trillion, down about $10 billion from the previous quarter and up about $40 billion from the Q2 of 2019.1
- In Q2 of 2020, the average auto loan term was 71.54 months for new cars and 65.3 months for used cars.7
- The average credit score for new auto loans in Q2 of 2020 was 718 for new vehicles and 657 for used vehicles.7
- Monthly car payments during Q2 of 2020 averaged $568 for new vehicles and $397 for used vehicles.7
- The average loan rate for Q2 of 2020 was 5.15% for new car loans and 9.69% for used car loans.7
Source: Experian, 2019 Consumer Debt Study
Debt Statistics by Demographic
Americans’ financial prospects differ significantly depending on their background. These statistics demonstrate how debt varies by factors like ethnicity, household type, and education.
- The median debt in 2019 was $79,000 among white households, $40,000 among Hispanic households and $27,500 among Black households. However, Black and Hispanic households carry much more debt proportional to median household assets. Median debt makes up 53% of median assets in Black households and 56% of median assets in Hispanic households, compared to just 26% of median assets among white households.8
- Average debt among those with a college degree was $217,530, compared to $94,300 among those with a high school diploma.8
- Average credit card debt was $6,940 among white households, $5,510 among Hispanic households, and $3,940 among Black households in 2019.8
- On average, couples with children owed $53,260 more than couples without children in 2019.8
Sources:
Federal Reserve, Quarterly Report on Household Debt and Credit, August 2020
Federal Reserve, Update on the Economic Well-Being of U.S. Households, July 2020
NerdWallet, Analysis of the Federal Reserve’s Quarterly Report on Household Debt and Credit, June 2020
Experian, 2019 Consumer Credit Review
Experian, 2019 Consumer Debt Study
The Institute for College Access and Success, Student Debt and the Class of 2019
Experian, Automotive Industry Insights Finance Market Report, Q2 2020
Federal Reserve, Survey of Consumer Finances, 1989-2019
Editorial & Advertiser Disclosure: The editorial content on this website is not provided, commissioned, reviewed, approved, or otherwise endorsed by any advertiser. Opinions expressed are ours alone, not those of any advertiser. The offers that appear are from companies from which we may receive compensation. However, this compensation does not impact where and how these companies are mentioned on the site. We do not include all companies or all available offers in the marketplace.
Related: