
It’s one of the biggest socioeconomic questions in the United States today: Why is inequality rising?
We recently surveyed Americans to learn more about the role the stock market plays in wealth inequality. We were specifically interested in the relationship between socioeconomic status and stock market investing and retirement preparation. Are those at the bottom investing? What challenges prevent people from investing more? Are Americans on track for retirement?
Here are the takeaways from the study.
Summary of Key Findings
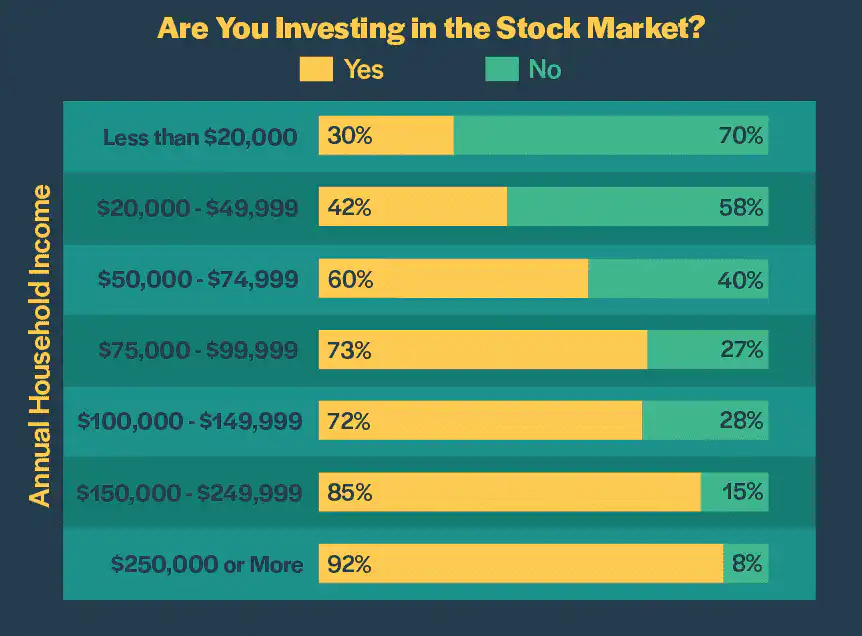
- Individuals with higher income and education levels are more likely to invest their money in the stock market. Only 30% of people earning less than $20,000 per year reported they are investing in the stock market. By comparison, an overwhelming majority (92%) of those earning $250,0000 or more per year are investing. Similarly, 32% of those with a high school degree or less are investing their money, while significantly more of those with a bachelor’s (69%) or postgraduate degree (75%) are.
- Individuals at lower income and education levels are more likely to believe the stock market is unfair. For example, 66% of those earning less than $20,000 per year “agree” or “strongly agree” that the stock market favors the wealthy and industry insiders. By contrast, only 32% of those earning $250,000 or more annually feel the same way.
- Individuals at lower income and education levels are less confident they will have enough money saved for retirement. Only 1 in 3 individuals earning less than $50,000 annually believe they will have sufficient retirement savings, while 96% of those earning $250,000 or more believe they will have enough. Similarly, approximately 50% of people with a high school degree or equivalent believe they will have enough money for retirement, and an even greater amount (62%) of those with a bachelor’s or advanced degree believe so.
- Wealth inequality may lead to greater political division. The more money a person earns, the more likely they are to prefer a more conservative approach to paying taxes, regardless of political ideology.
People With Higher Income and Education Levels Are More Likely to Invest
We first wanted to learn about the relationship between income level and investing habits. Here is what we found.
Individuals at higher income levels are more likely to invest and plan for retirement. That makes sense because they have more discretionary income, which they can save and invest for the future. Lower-income individuals, by comparison, must allocate a greater portion of their take-home pay toward necessities such as food, housing, utilities, health care, and transportation.
The directional differences are not surprising. One would expect those earning more to have more money to put away. However, the size of the gap between high- and low-income respondents is striking. Only 30% of those earning less than $20,000 annually are investing in the stock market. By contrast, 92% of individuals with a household income of $250,000 or more reported they are investing their money.
We see a similar pattern when breaking down the demographics by education level. The more education a person has, the more likely they are to invest in the stock market.

Only 32% of individuals with a high school degree or less are investing in the stock market. Conversely, 69% and 75% of those with a bachelor’s or advanced degree are investing their money, respectively.
Low- and Middle-Income Earners Face Similar Investing Challenges
We wanted to understand the challenges that prevent people from investing more of their money in the stock market. What barriers are holding back individuals who earn less?
For easier comparison, we grouped survey respondents into three cohorts based on their household income level: low ($0 to $49,999), middle ($50,000 to $149,999), and high ($150,000 or more).
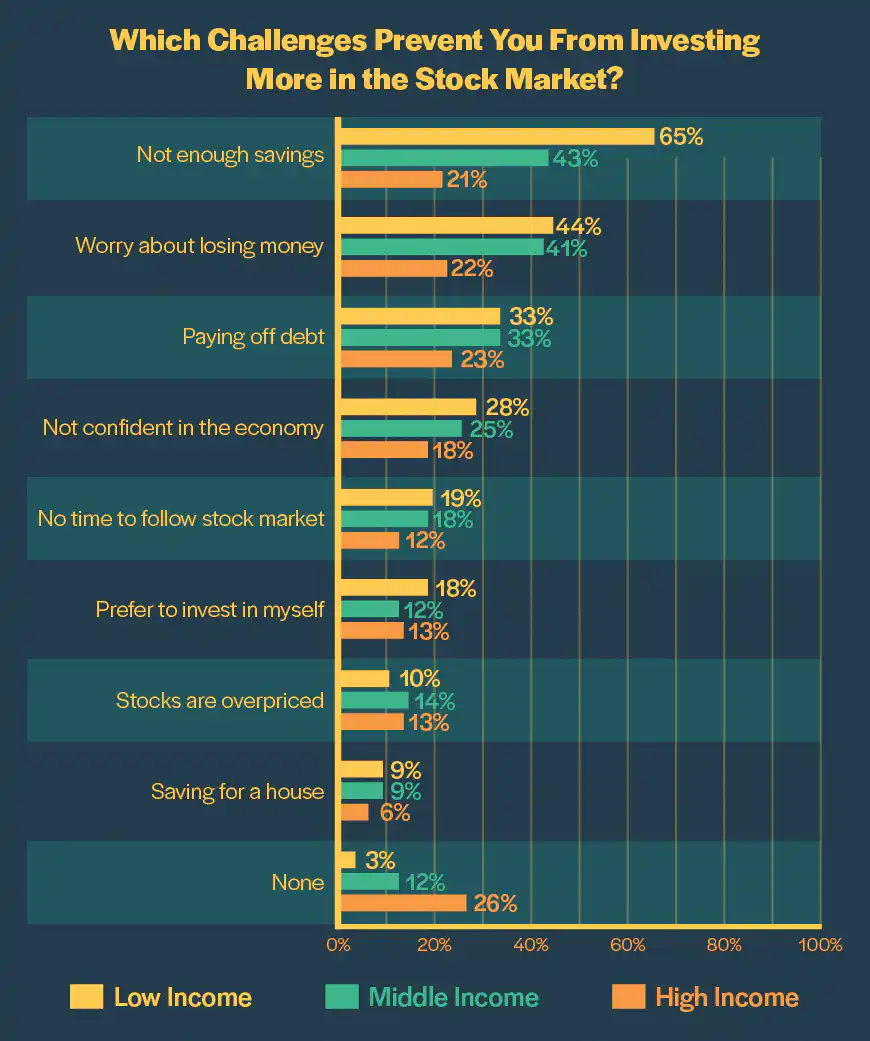
Clearly, individuals in the low- and middle-income tiers are facing more hurdles. The most common challenge they cited was not having enough savings to invest, followed by worry over losing money in the stock market and the need to pay off existing debt first.
Disparities of Faith in the Stock Market
Public resentment and suspicion of Wall Street is nothing new. These feelings boiled over in the Occupy Wall Street movement that followed the global financial crisis of 2007 to 2009. But how prevalent are these sentiments today? Do people believe the stock market is a level playing field?
In order to find out, we asked respondents to rate their level of agreement with the following statement: “The stock market is unfair to the average investor. It favors the wealthy and industry insiders.” Answers were quantified on a 5-point scale (1 = Strongly Disagree, 2 = Disagree, 3 = Neither Agree nor Disagree, 4 = Agree, 5 = Strongly Agree).
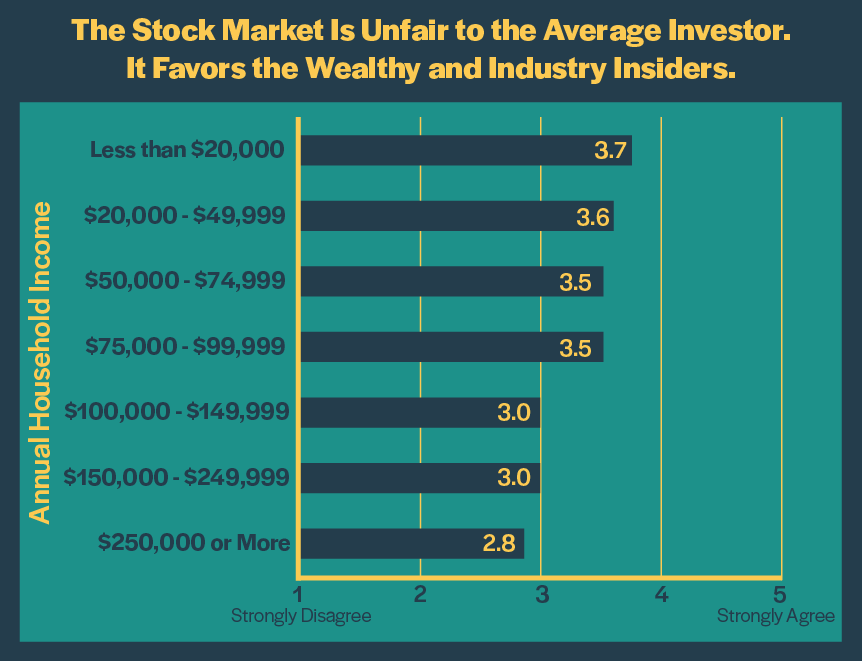
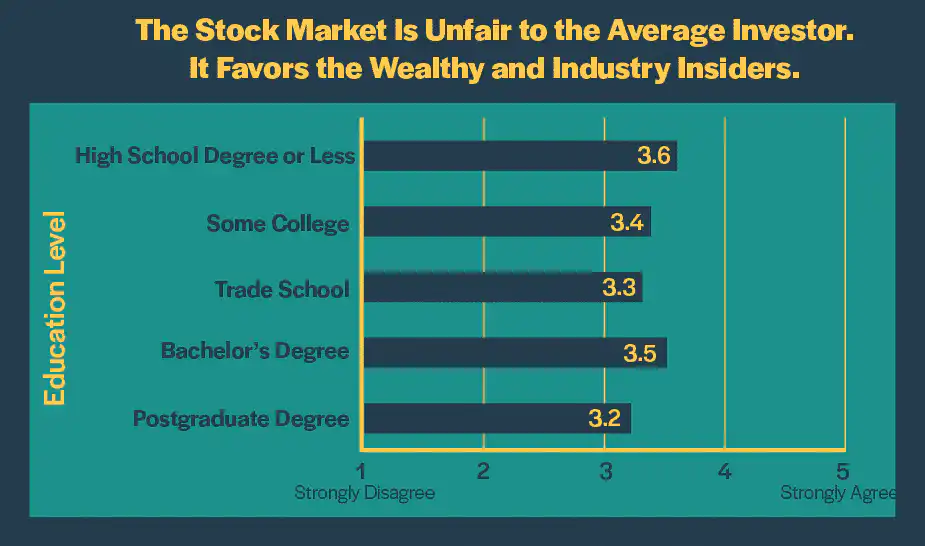
Those at the bottom of the economic ladder are more likely to believe the stock market is unfair. They feel they have less access to ways to grow their wealth through investing. Overall, 66% of people who earn less than $20,000 per year reported they “agree” or “strongly agree” with the statement. Only 32% of those with a household income of $250,000 or more felt the same way.
Similarly, individuals with less education are more likely to perceive the stock market as unfair than those who have attained a higher education level.
Although there’s no evidence to suggest the stock market is rigged, the wealthy do have advantages over the average investor. Specifically, they have more access to sophisticated financial data and trading information, more political influence, and the greater economies of scale that come with having more capital. That may, in part, explain the disparity of faith in the stock market.
Those at Higher Socioeconomic Levels Are Better Prepared for Retirement
There are a variety of reasons why people invest their money. They may be saving for their childrens’ college education, preparing to make a down payment on a home, purchasing a car, or starting a new business. But one of the primary reasons the average person invests is for retirement. They want to have a nest egg they can live off of comfortably when they can no longer work.
When it comes to economic inequality, income and wealth inequality receive most of the headlines. But what about retirement inequality? How does preparation for retirement vary across different socioeconomic groups?
In order to find out, we asked participants a simple question: Do you have a retirement account? We defined a retirement account as any type of investment account specifically set aside for retirement, such as an IRA, 401(k), or pension. Here is what we found.
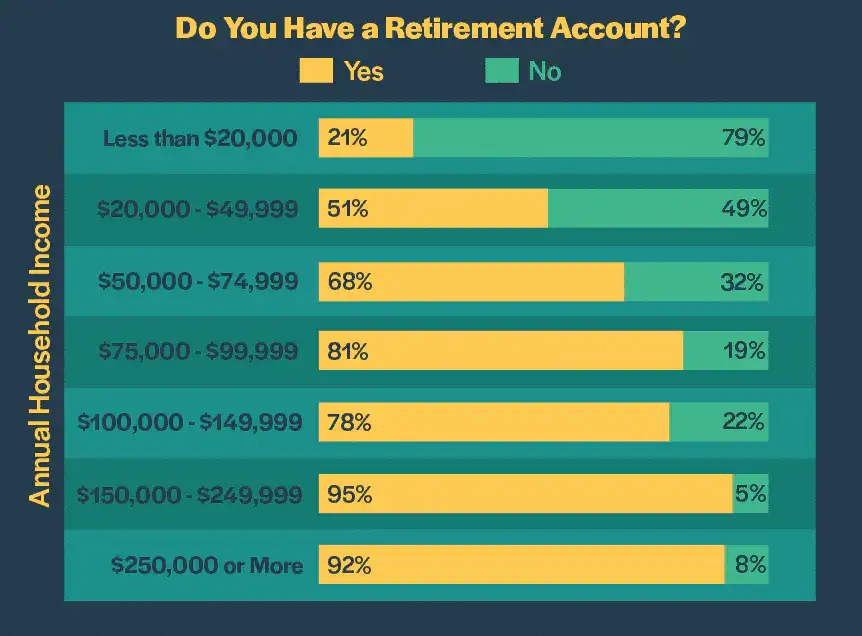
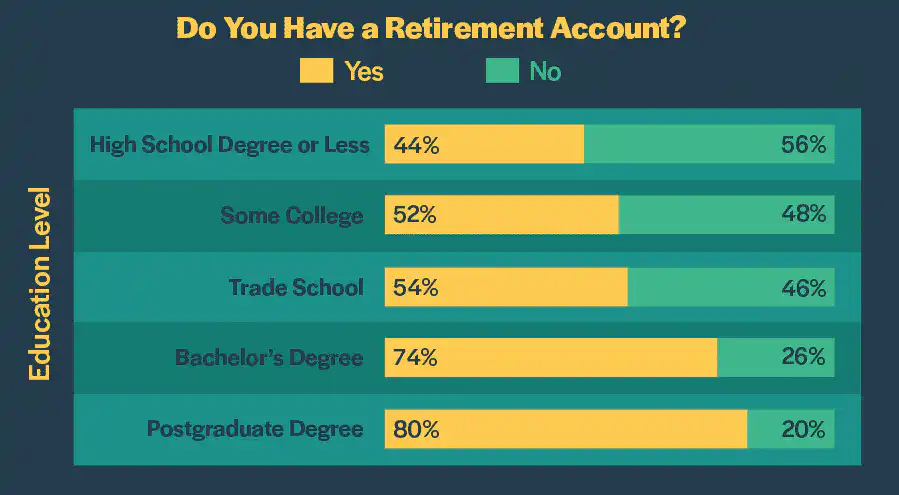
We see a pattern similar to personal investing habits: Those with greater income and education levels are more likely to have a retirement account.
Those at Lower Income and Education Levels Are Less Confident They Will Retire
Income and investing habits only go so far in determining how prepared someone is for retirement. A person’s ability to retire comes down to how much money they have saved relative to their spending habits. For example, a person earning a high income may not be on track for retirement if they aren’t saving a significant portion of their paycheck each month.
We wanted to know how secure people feel financially. Are they prepared for the future? Will they be able to retire at the end of their careers?
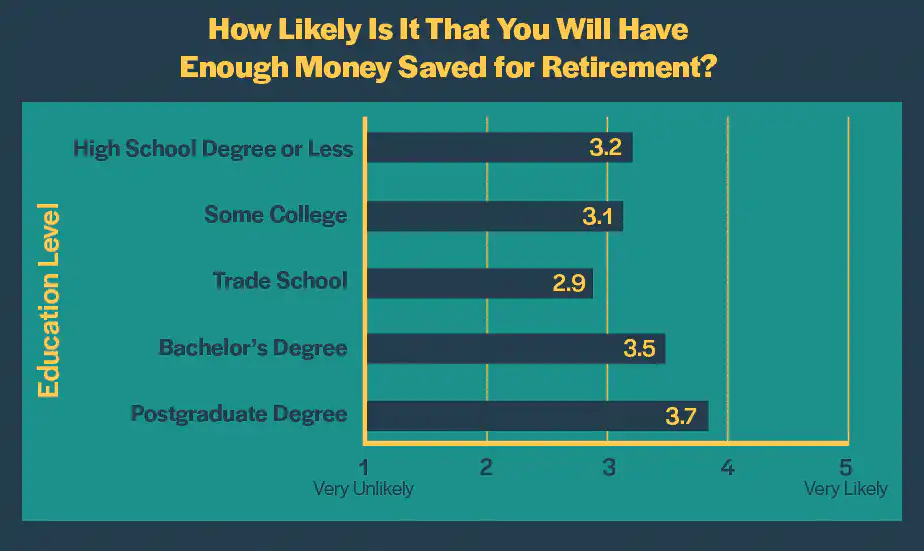
We asked respondents how likely it is that they will have enough money saved for retirement. Answers were recorded on a 5-point scale (1 = Very Unlikely, 2 = Unlikely, 3 = Neither Likely nor Unlikely, 4 = Likely, 5 = Very Likely). Here are the average scores across each cohort.
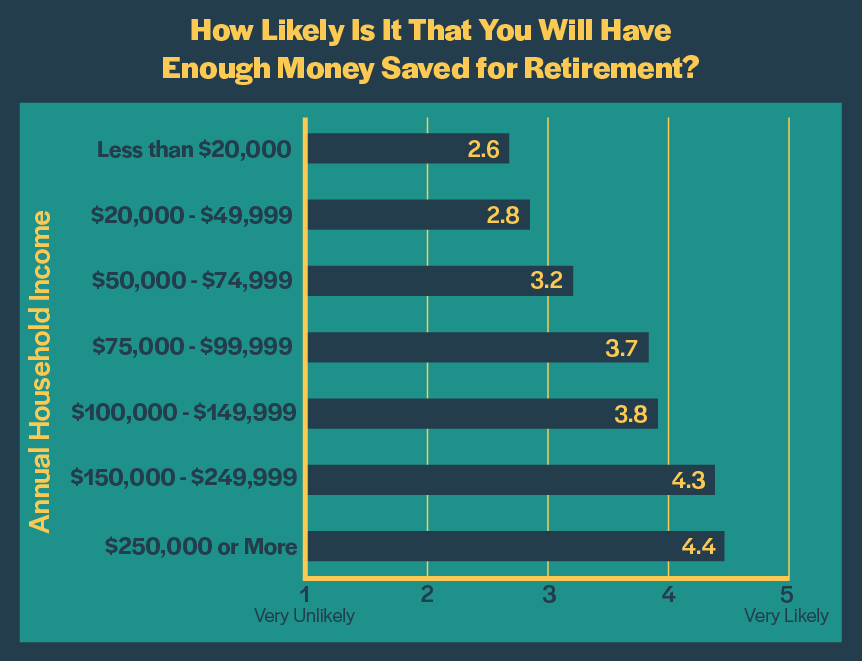
Those at the bottom are less confident they will be able to retire. More than half (52%) of people earning less than $20,000 per year said it was “unlikely” or “very unlikely” they will have enough retirement savings. Slightly less than half (47%) of those in the next income tier ($20,000 to $49,999 annually) reported it was “unlikely” or “very unlikely.”
Individuals earning higher incomes are much more optimistic about their chances. The overwhelming majority (91%) of people with incomes between $150,000 and $249,999 said it was “likely” or “very likely” they will have enough to retire. Even more (96%) of those at the top income bracket ($250,000 or more annually) said it was ” likely” or “very likely.”
Again, we see a similar trend by education level. Those with a bachelor’s or postgraduate degree are more confident they will have enough retirement savings.
Top Earners Predict They Need to Save More to Retire
We were curious how much money people think they need to save for retirement. We asked respondents to select from the following ranges:
- Less than $100,000
- $100,000 – $249,999
- $250,000 – $499,999
- $500,000 – $999,999
- $1,000,000 – $1,999,999
- $2,000,000 – $3,999,999
- $4,000,000 – $9,999,999
- $10,000,000 or more
Although top earners are more confident they’ll reach the financial threshold needed to retire, they also predict they will need more money saved to retire comfortably. Below are the median answers across each income group.
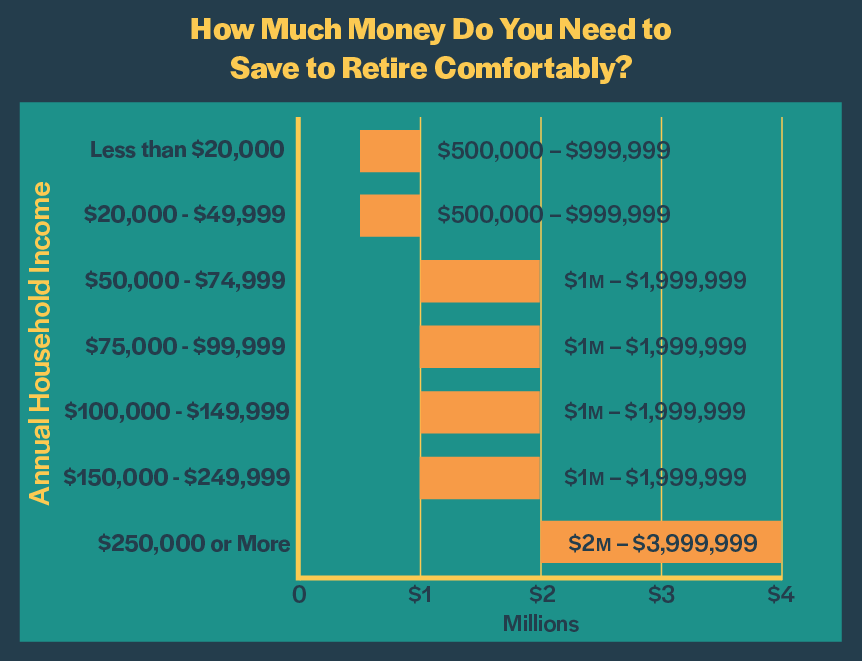
Those at the top are more confident they’ll have a greater amount saved for retirement, while those near the bottom are less confident they’ll have even a marginal sum saved for retirement.
Greater Inequality May Lead to More Political Polarization
We asked respondents to choose between two retirement choices: 1) pay higher taxes but receive a government-guaranteed pension, or 2) pay lower taxes but save for your own retirement.
For simplicity purposes, we again divided respondents into three income brackets.
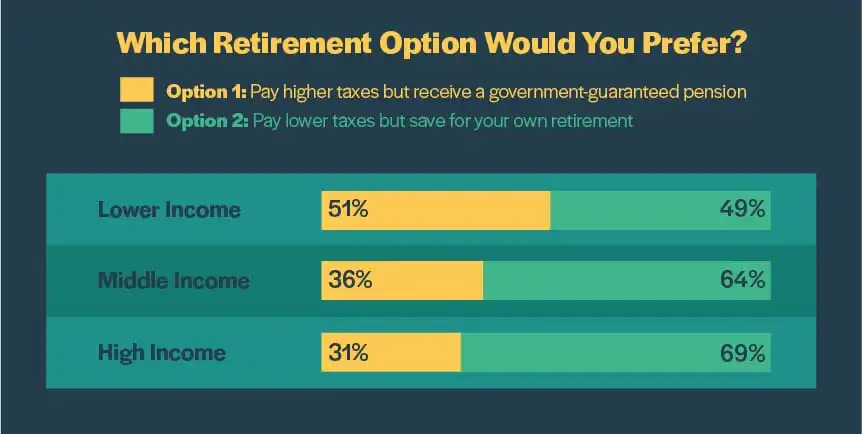
People at lower income levels are more likely to prefer higher taxes if they could receive a guaranteed pension from the government. This reflects a sense of greater financial insecurity. Because they have less of a financial cushion, they’re more likely to prefer the less risky choice. They’re uncertain they will have enough retirement savings, and therefore, they want to know they’ll be OK when they reach older age. Those at the middle and high income levels, by comparison, are more comfortable saving for their own retirement.
But what happens when you break down the data by political stance? Does the difference in opinion disappear?
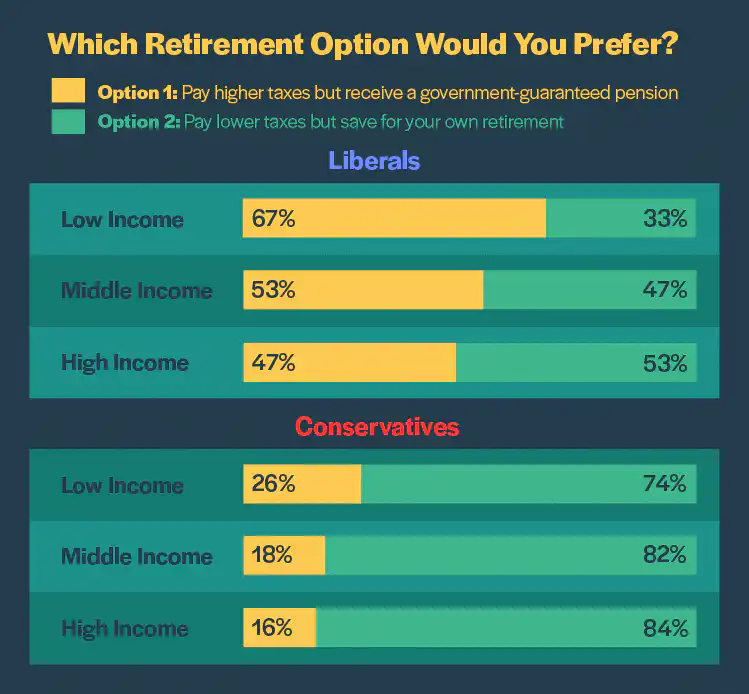
Diverging viewpoints still exist even when you compare people with similar political perspectives. For example, liberals at low income levels prefer option 1 at a higher rate compared to those at middle and high income levels. The same trend holds true for conservatives. Conservatives earning a low income are more likely to prefer paying higher taxes relative to conservatives at middle and high income levels.
This data suggests that economic inequality may contribute to political division. Those at the bottom prefer a policy that delivers higher taxes and more financial security, while those at the middle and high income levels strongly prefer a different policy.
Many Americans Have Not Benefited From Record Economic Growth
The U.S. economy has been on a tear the past decade. It’s been the longest streak of economic expansion in the nation’s history. Since the Great Recession bottomed out in 2009, the country’s Gross Domestic Product, or GDP, has increased for 125 consecutive months. During this period, the unemployment rate declined from 10% to 3.6% as of October 2019. The housing market has rebounded, and the stock market has soared to all-time highs.
But not everyone has felt the benefits. According to the Federal Reserve, U.S. household wealth – or the value of a family’s assets minus its liabilities – has increased from $56.8 trillion to $107.1 trillion over the past 10 years. However, a disproportionate amount of this wealth has gone to those at the top. Only 2% of the growth in wealth has gone to the bottom 50% of the population, while nearly 72% went to the wealthiest 10%. The richest Americans now own the greatest slice of the nation’s wealth in history.
Below is a view of the growth in net worth across different wealth distribution levels. The top 10% towers over the bottom 50%, which is barely visible on the chart.
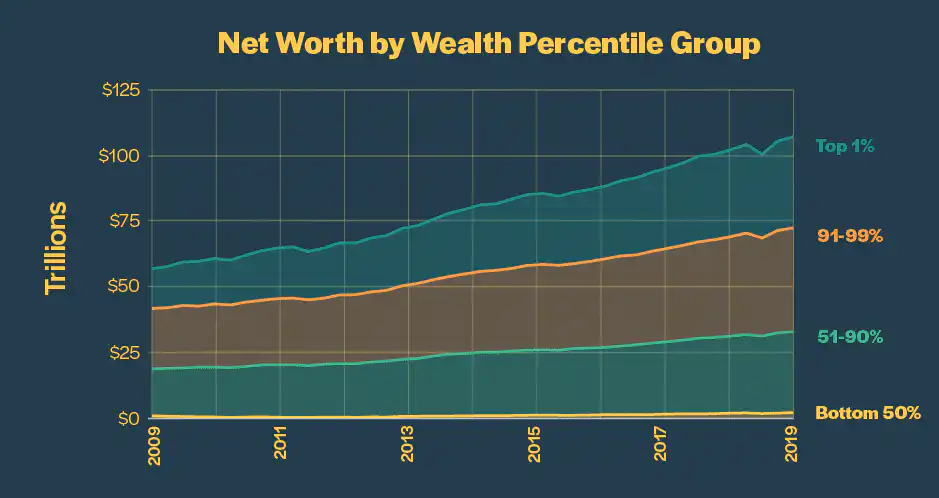
Inequality.org reports the top 10% of earners average more than nine times as much annual income as the bottom 90%. The discrepancy is even more pronounced at the highest distribution level: The top 1% earn 39 times more than the bottom 90%. The United States has the greatest gap between rich and poor of any developed nation.
The wealth gap makes it harder for certain groups to climb the economic ladder. It affects their ability to access education, receive health care, purchase a home, or take out a loan to start a business. It creates divisions in society.
Causes of Rising Inequality
The stock market typically doesn’t receive a significant amount of attention when it comes to inequality. What does? Here are some of the primary reasons mentioned in political discussions today.
Technology
Computers and machines have replaced many middle-class jobs, especially those in the manufacturing sector. In the 1960s, the largest employers in the country were General Motors, General Electric, and U.S. Steel. Many of these skilled blue-collar jobs have been automated away, while the amount of lower-skilled service jobs has increased. Today, the largest employers are retailers such as Walmart, Home Depot, and Kroger.
Globalization
Fewer trade barriers and the growth of multinational organizations have made it easier for companies to offshore work to countries with cheaper labor. In a hypercompetitive marketplace, businesses are forced to reduce costs as much as possible, and labor is one of the biggest cost centers.
Americans are now competing against the entire world, not just those who live in the same geographic area. This dynamic has caused downward pressure on wages.
Decline of Organized Labor
Changes in legislation have made it harder for workers to unionize. Currently, 28 states have “right-to-work” laws, which stipulate that workers cannot be compelled to become union members as a requirement of their job. Approximately 10% of Americans are part of a union. That’s about half the amount from a few decades ago.
Historically, unions have negotiated higher pay for all workers, but especially those earning lower wages. Research has shown that countries with higher union participation have lower income inequality.
Tax Policy
Taxes can play a major role in income distribution. The U.S. has a progressive tax system, meaning high-income households pay a larger percentage of their income in federal taxes than low-income households. However, U.S. tax policy has done little to reduce income inequality over the past 40 years.
With bipartisan support, the Reagan administration dramatically cut tax rates. The top marginal tax rate was reduced from 50% in 1981 to 28% in 1986, and the corporate tax rate declined from 50% to 35%. These tax cuts have largely remained intact. Today, the top marginal rate is 37%.
The administration of George W. Bush also implemented tax cuts on estates, dividends, and capital gains – which provided benefits to all income groups, but especially wealthier households who own more investments and financial assets.
Increase in Housing Costs
Homeownership remains one of the best ways to build wealth. But many Americans are struggling to find affordable housing. Home values have appreciated while wages have stagnated for lower- and middle-class families. As a result, more people are unable to purchase a house and are forced to rent instead.
At the same time, urbanization has led to a scarce supply of affordable rental options in many cities. The result is a negative feedback loop that has widened the gap between homeowners and renters.
Conclusion
One the one hand, the stock market is one of the greatest drivers of economic growth and wealth. It allows companies to raise capital from the public, and it allows investors to purchase shares of businesses in order to get a slice of future earnings.
On the other hand, it only benefits those with a seat at the table. People who don’t invest are left behind. In fact, the wealthiest 1% of American households own 50% of stocks, showing just how much stock ownership is concentrated at the top of the economic ladder.
These findings demonstrate that unequal access to the stock market is exacerbating America’s inequality issues. Those at higher income levels have more discretionary income and, therefore, are able to invest their savings so it can compound and grow over time. That’s why they’ve benefited so much from the gains in the stock market over the past 10 years. Those at lower income levels have less money left over each month and, as a result, struggle to invest for the future and prepare for retirement.
There are significant disparities in people’s faith in the stock market and their ability to access it. Many Americans, especially those at lower income and education levels, remain deeply suspicious of Wall Street and the fairness of the securities markets themselves.
As a result of these contrasting economic realities and perspectives, there’s a large imbalance between those who will be able to retire securely and those who won’t. And the consequences of wealth inequality extend beyond one person’s lifetime. Building up a large estate can have generational effects. Wealth can be passed on to family descendants, which perpetuates future cycles of inequality.
When people don’t feel like they have an opportunity for upward mobility, they are less likely to participate in civic engagement. The research findings in this report indicate that economic inequality may fuel political polarization.
In a capitalist society, a certain level of inequality is inherent. The question is: How much is too much? And how can access to financial vehicles be open to more people so that they can grow their wealth? How can more Americans benefit from the country’s economic engine?
There’s no simple solution. Ultimately, however, there’s a need for personal finance education to be taught in schools and for more reputable, easy-to-understand information to be available online. With improved financial literacy, Americans can make sound decisions and be good stewards of their money. They can learn about budgeting, credit, entrepreneurship, and the importance of starting to save and invest at an early age.
Methodology
This is the first report of a multi-part series based on a survey of 1,017 adults conducted between July 7, 2019, and November 5, 2019, by Money Crashers. Responses were collected by sharing the survey on social media, email, and online forums and through Prolific’s panel services. For the analysis in this article, only responses from individuals who live in the United States (n=919) were considered. The participants were 48% male and 52% female.
Editorial & Advertiser Disclosure: The editorial content on this website is not provided, commissioned, reviewed, approved, or otherwise endorsed by any advertiser. Opinions expressed are ours alone, not those of any advertiser. The offers that appear are from companies from which we may receive compensation. However, this compensation does not impact where and how these companies are mentioned on the site. We do not include all companies or all available offers in the marketplace.
Related: