A certificate of deposit, or CD, is an excellent place to park cash you don’t need immediately. The federal government insures it, and it usually pays more than a standard savings account. Its yield (interest rate) is guaranteed for the entire term.
That rate guarantee is important because CD rates can be volatile — really volatile. Since 1967, the average yield on the three-month CD — considered a key CD indicator because it’s so sensitive to prevailing interest rates — has ranged from a high of 18.5% in the early 1980s to a low just above zero for long stretches in the 2010s and early 2020s.
To understand why, we combed through 50+ years of historical CD rate data and then compared the changes we saw against economic events and interest rate movements occurring simultaneously.
Historical CD Rates in the United States: Key Findings
Our historical CD rate analysis uncovered six interesting trends that could change how you think about certificates of deposit — and where you choose to park extra cash you don’t need right away:
- CD rates closely track the federal funds rate
- Shorter-term CDs are more sensitive to changes in the federal funds rate than longer-term CDs
- CD rates peaked in the early 1980s as the Federal Reserve spiked the federal funds rate to quash inflation
- CD rates have generally declined over time — the three-month CD remained above 5% annual percentage yield (APY) for most of the period between 1967 and 1990 but hasn’t regained that level since 2007
- Shorter-term CD rates often yield less than the inflation rate, resulting in negative real returns
- CD rates are often higher during or just after recessions, offering a less risky alternative to the stock market during periods of economic uncertainty
How to Use Our CD Rate Analysis
Our historical CD rate analysis begins in 1967 and ends in 2024. We divided it by decade for easier reading, so if there’s a period you’re particularly interested in, you can scroll right to it.
Each historical section summarizes important economic events and interest rate activity to provide context for CD rate fluctuations. The final section looks ahead to the next economic cycle and lays out our best guess regarding CD rates in January 2025.
Data Sources & Methodology
We created the charts and supported our analysis using historical CD rate data from the Federal Deposit Insurance Corporation, aka FDIC, and Mortgage-X. Where useful, we pulled in other historical rates and key economic indicators, such as the federal funds rate, the 30-year mortgage rate, the Consumer Price Index (an important inflation measure), and the unemployment rate.
We based our analysis on three-month CD rates, which tend to be lower than rates on longer-term CDs (six-month, 12-month, 24-month, and so on). However, three-month CD rates are closely correlated with longer-term rates, so the historical trend line is consistent.
Overview: 1967 – 2024
Back to the beginning, or at least as far as our data for historical CD rates takes us (1967).
Interest on three-month CDs bottomed out around 5% APY in 1967, then steadily climbed to 8% as the 1960s drew to a close.
Even 5% APY on a three-month CD is generous, but things were different back then. The floor for the federal interest rate was much higher — above 3.00% from 1963 to 1992 — which pushed up yields on consumer deposit products like CDs. Banks didn’t love paying 5% or more on short-term CDs, but they could afford it because mortgage rates and other profitable loan types were still higher.
According to Freddie Mac, homebuyers with good credit paid a 7% to 8% annual percentage rate on home purchase loans in 1972.
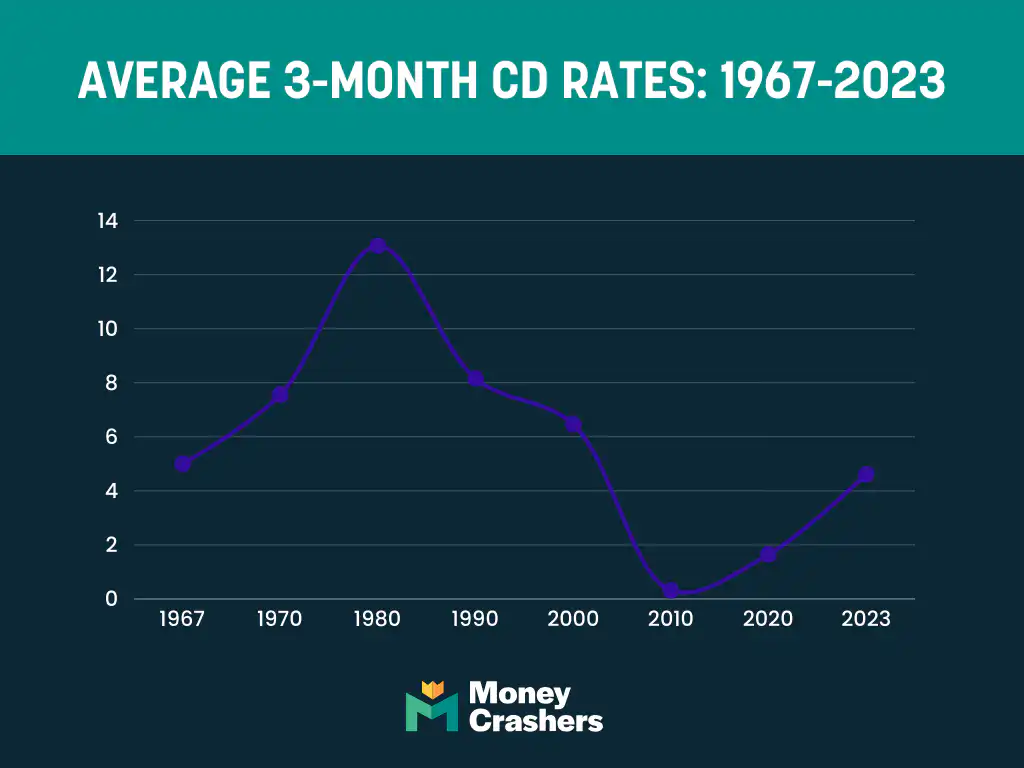
Rates oscillated between 5% and 11% APY for most of the 1970s. They spiked dramatically in the early 1980s, topping above 15% APY in 1981 and remaining above 9% until 1984. They remained between 5% and 10% until 1991 when a weak and near-deflationary economy pushed interest rates to the lowest levels in decades.
A period of relatively cheap capital ensued, setting the stage for an era-defining economic boom in the 1990s. Three-month CD rates eventually regained the 5% level and bounced around just above it for a few years before collapsing in the economic recession of the early 2000s.
Except for a brief period just before the Great Recession of the late 2000s, they’d never break 5% again. From 2010 onward, the average three-month CD rate remained near zero.
Decade Close-Up: 1970 – 1979
The 1970s dawned with three-month CD rates around 8% APY, comfortably ahead of the 6% inflation rate.
That pattern — short-term CD rates outpacing inflation — continued until 1974, when inflation spiked above 11%. CD rates rose too, but not fast enough to keep pace, and the near-term high of about 10% APY in late 1974 still produced a negative real return for savers.
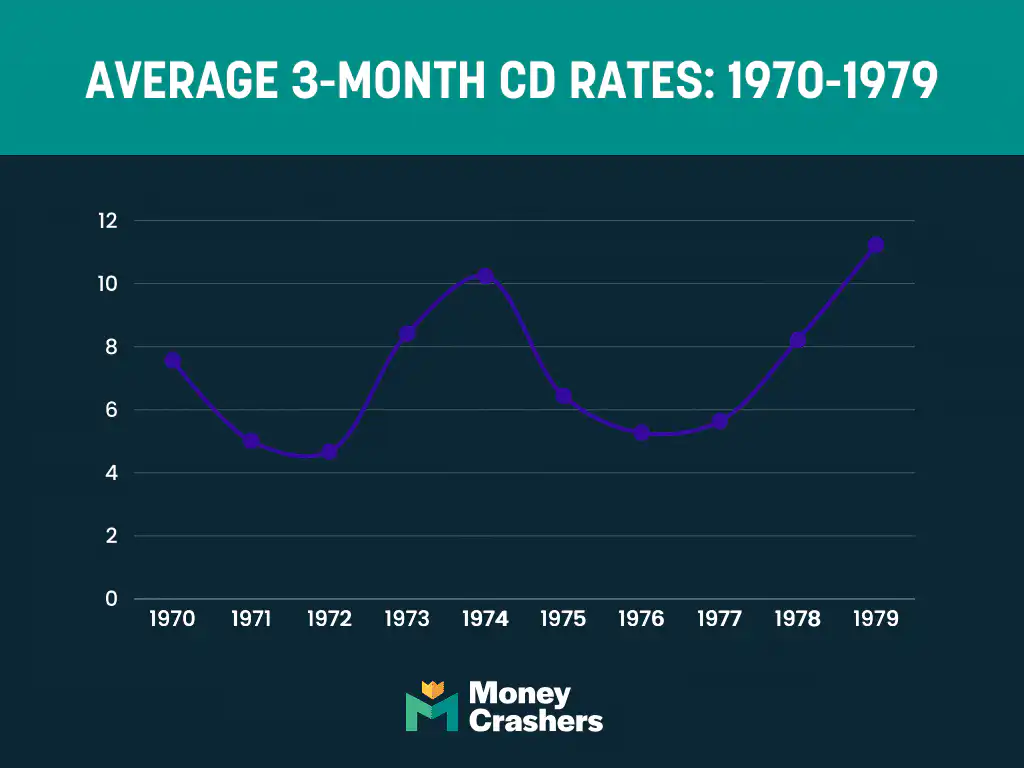
The immediate culprit for this round of inflation was an oil embargo enforced by Arab members of the Organization of the Petroleum Exporting Countries, commonly known as OPEC, in retaliation for the United States’ support of Israel during the Arab-Israeli War of 1973. At the time, the U.S. was far more dependent on Middle Eastern oil than it is today, and even small changes in the price or availability of fuel could have huge economic consequences.
Fortunately, the embargo ended in 1974, and the inflation rate slowed to 5%. CD rates followed suit. The three-month CD was roughly inflation-neutral from 1975 to 1978.
But the good times didn’t last. Another oil market shock began in 1978, and by 1980, prices had more than doubled from two years earlier. U.S. and Western European leaders blamed the Iranian revolutionaries who ousted the oil-rich nation’s stable, pro-Western government, but those countries bore some responsibility as well. Almost as soon as the unrest began, oil importers like the United States began hoarding the stuff, taking millions of barrels off global markets and forcing buyers to pay a stiff premium for what remained.
As sure as night follows day, the U.S. consumer price index jumped, passing 11.5% in 1979 to levels not seen in living memory. CD rates followed. But as with the previous oil shock, they couldn’t keep up. Real three-month CD yields closed out the 1970s in negative territory and would stay there through 1981.
Decade Close-Up: 1980 – 1989
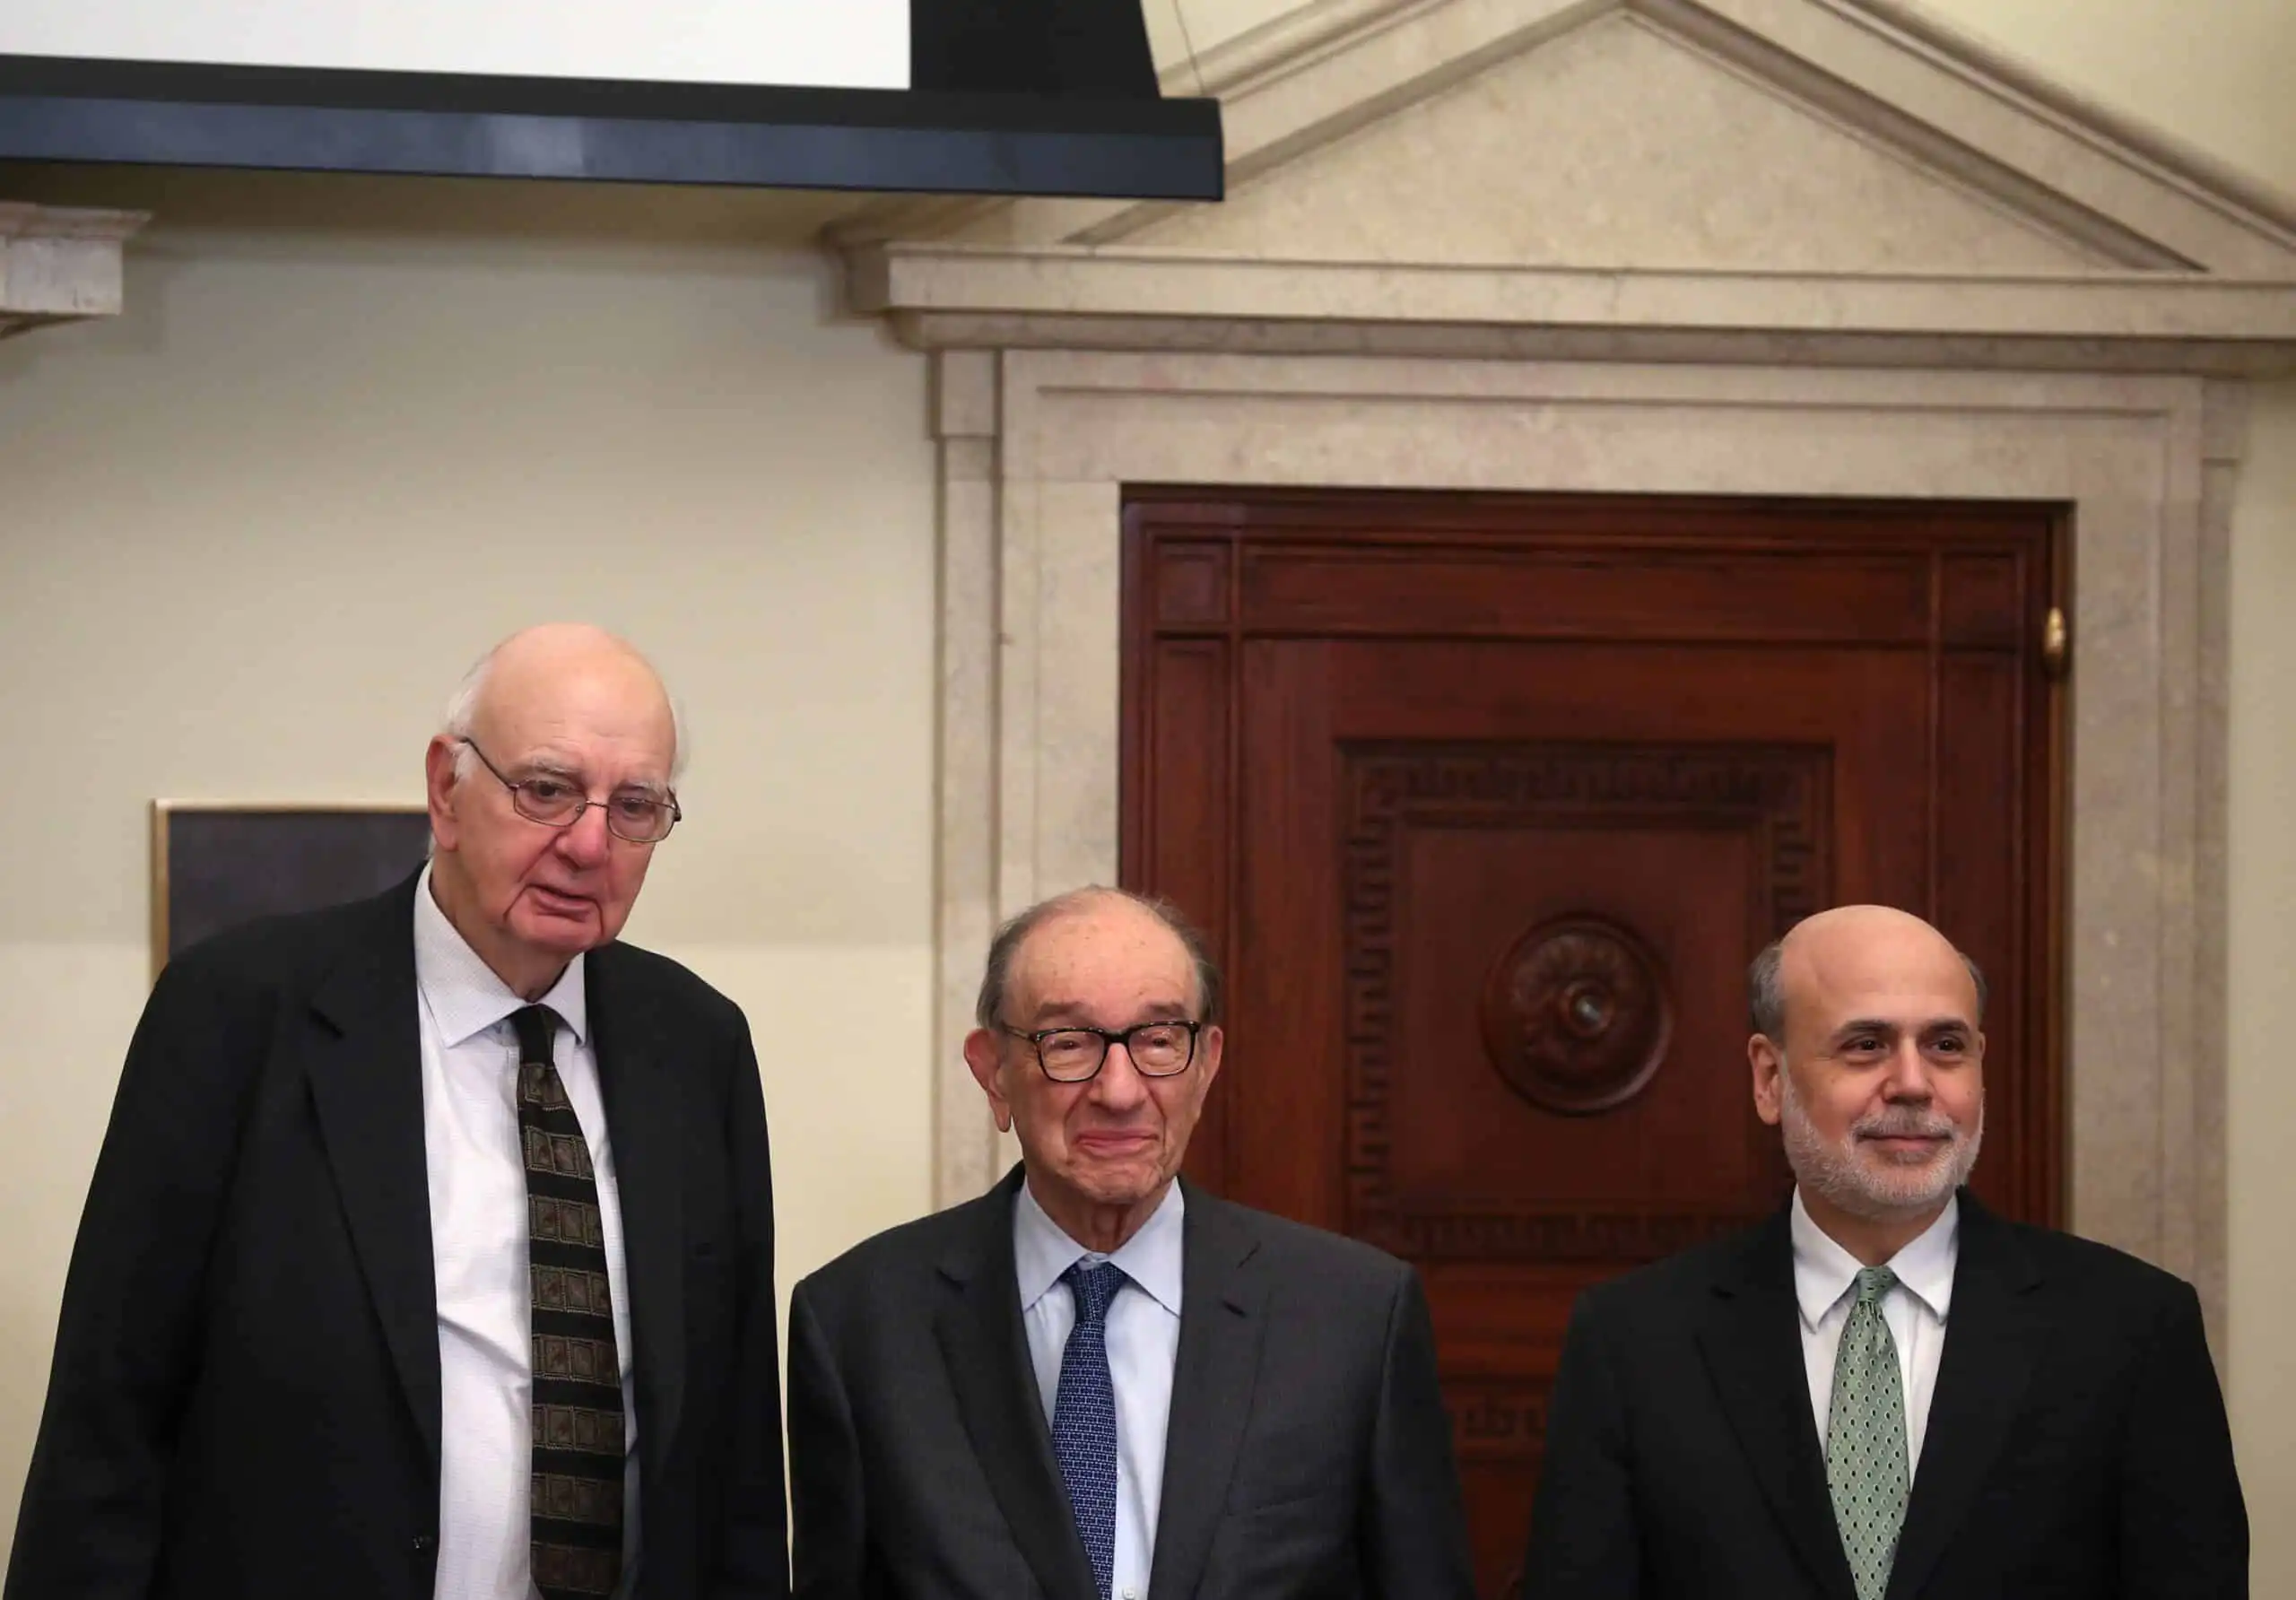
From a macroeconomic perspective, the 1980s began on Oct. 6, 1979, when newly installed Federal Reserve Chairman Paul Volcker called an emergency meeting of the Federal Open Market Committee (the group that oversees federal interest rates) and set in motion what would come to be known as the Volcker Shock.
In essence, Volcker and his fellow inflation hawks — who now dominated the committee — would allow the all-important federal funds rate to rise as high as necessary to choke off inflation. That meant accepting the likelihood of a prolonged economic recession, forcing consumers and businesses to reduce spending, thereby stabilizing prices.
Volcker got his wish — twice. Two relatively brief but sharp recessions, known by some as a “double-dip” recession, helped quell runaway inflation. But not before the federal funds rate soared past 18%, dragging three-month CD rates along with it. For a time in 1981, banks were paying 18%+ annualized interest on 90-day certificates of deposit, an absolutely mind-boggling state of affairs for those of us accustomed to the near-zero interest rate regime of the 2010s.
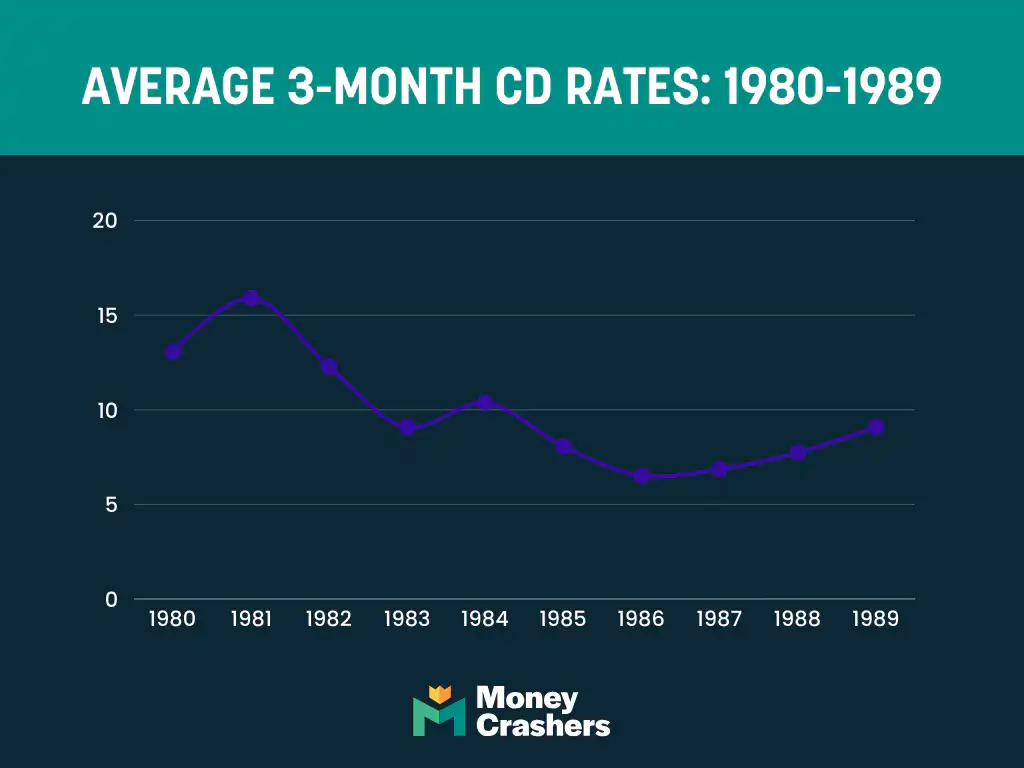
Though short-term CD rates remained lower than the federal funds rate during the ’80s, they outpaced the Consumer Price Index, the U.S. government’s official measure for consumer inflation. In other words, the early 1980s was an OK time to be a saver—if you had any income to save—with the unemployment rate above 8% for much of the period, many consumers didn’t.
By 1984, when President Ronald Reagan’s reelection campaign declared it “Morning in America” once more, the double-dip recession was in the rearview mirror, and the economy was humming along nicely. Interest rates remained elevated — the federal funds rate wouldn’t dip below 8% until mid-1985 — which propped up CD rates.
However, there was a key difference from the first part of the decade, which undoubtedly contributed to the feeling that America was back: Inflation was much lower. The real return on a three-month CD yielding 9% APY in early 1985 was at least 3% and probably more like 5%, depending on your preferred inflation measure. Americans could get ahead merely by parking cash in an FDIC-insured account and waiting a few months.
CD rates would outpace inflation for most of the 1980s, though the gap began to narrow as inflation rose toward the end of the decade, and the Federal Reserve began a new tightening cycle to cool things off.
The back half of the 1980s also saw a wave of bank failures related in part to the Federal Reserve’s frantic efforts to get inflation under control a few years earlier. Saddled with billions in expensive, unmanageable debt, more than 1,000 small financial institutions — banks that should have gone out of business in the early ’80s but were allowed to stay open by overburdened regulators who lacked the resources to wind them down — finally shut their doors in a washout known as the Savings and Loan Crisis, which peaked in 1989.
With persistent inflation and a prolonged real estate downturn in many parts of the country, the stage was set for a brief recession that would bring CD rates back down to Earth.
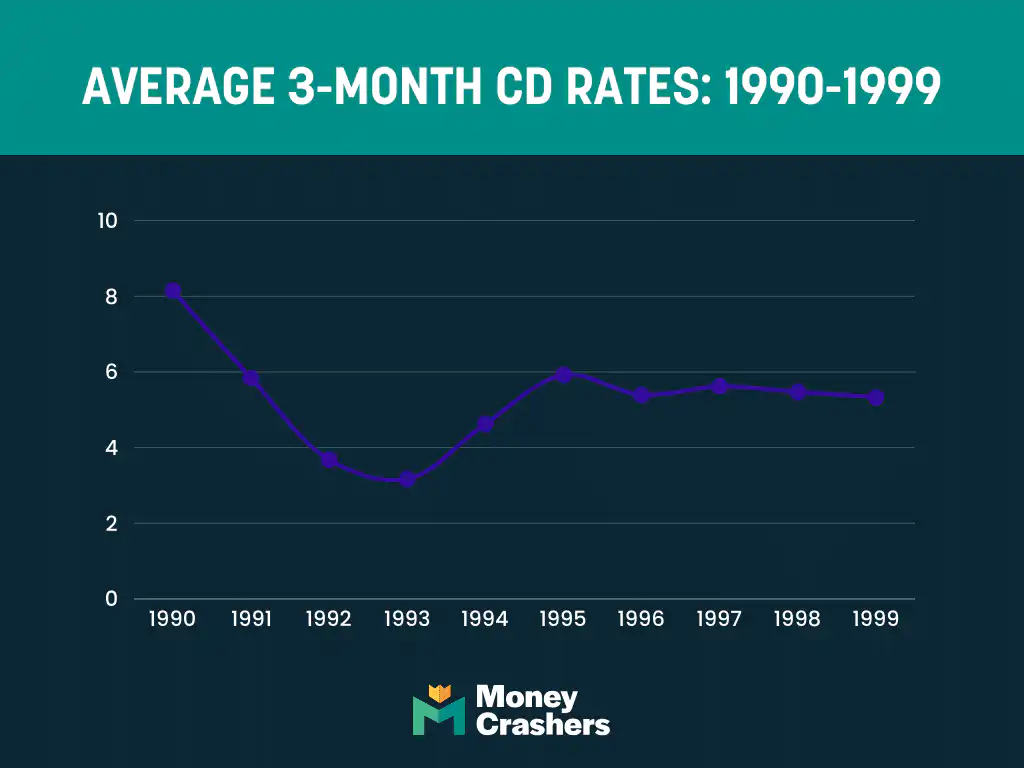
Decade Close-Up: 1990 – 1999
That S&L Crisis-caused recession arrived in mid-1990, lasted less than a year, and was generally considered mild. However, it had a noticeable and lasting effect on short-term CD rates, which by 1993 had reached their lowest point since 1967 (about 3% APY).
Though rates reached 5% APY again in the middle of the 1990s as the U.S. economy boomed, that level now seemed to be more of a ceiling than a floor. Consumers probably didn’t mind, though. Inflation remained in check — between 1.5% and 3% APY annually — so real CD returns were comfortably positive.
Although Americans old enough to remember the 1990s recall a decade of sustained growth and prosperity, it was quite rocky elsewhere in the world. From 1995 to 2000, several major emerging economies — Mexico, Russia, and Southeast Asia — experienced full-blown monetary crises that threatened to destabilize the global economy. But the carnage never came ashore here, and Americans who didn’t follow the news closely or check stock tickers regularly were none the wiser.
It helped that the U.S. had emerged from the Cold War as the world’s sole economic superpower, with an increasingly vibrant tech economy driving unprecedented productivity growth. In a mirror image of the 1970s, energy prices remained low for most of the 1990s.
Not surprisingly, this was a great time to invest in the stock market. The Dow Jones Industrial Average more than doubled between 1995 and 2000.
Like the mid-1980s, it was also a fantastic time to be a saver. Though the Fed raised interest rates in 1994 and 1995 and kept them above 5% APY until 2001, inflation barely budged. If you’d purchased a three-month CD in early 1995 and rolled it over (and over and over) at maturity until early 2000, your inflation-adjusted balance would have grown between 10% and 20% in five years.
Of course, The good times wouldn’t last. By 2000, the tech sector was clearly in the throes of a speculative bubble, and businesses elsewhere were exhausted after years of unrelenting investment. The Federal Reserve began a mini-tightening cycle in a last-ditch effort to prevent a recession, sending CD rates toward 5% AP.
Decade Close-Up: 2000 – 2009
Despite the Federal Reserve’s best efforts, the early 2000s recession came. Officially, it lasted only seven months, from March to November 2001, but the pain wasn’t evenly spread. The tech industry took years to recover after the bubble burst. Energy and telecommunications were also hit hard. Two massive corporate accounting scandals compounded the carnage, bringing down oil giant Enron and telecom behemoth WorldCom in the process.
Like the early-1990s recession, the early-2000s contraction also marked a regime change for CD rates. Short-term CD rates fell as the recession set in and kept falling, even as the economy began to expand again, ultimately bottoming out in 2004 at then-record lows around 1% APY.
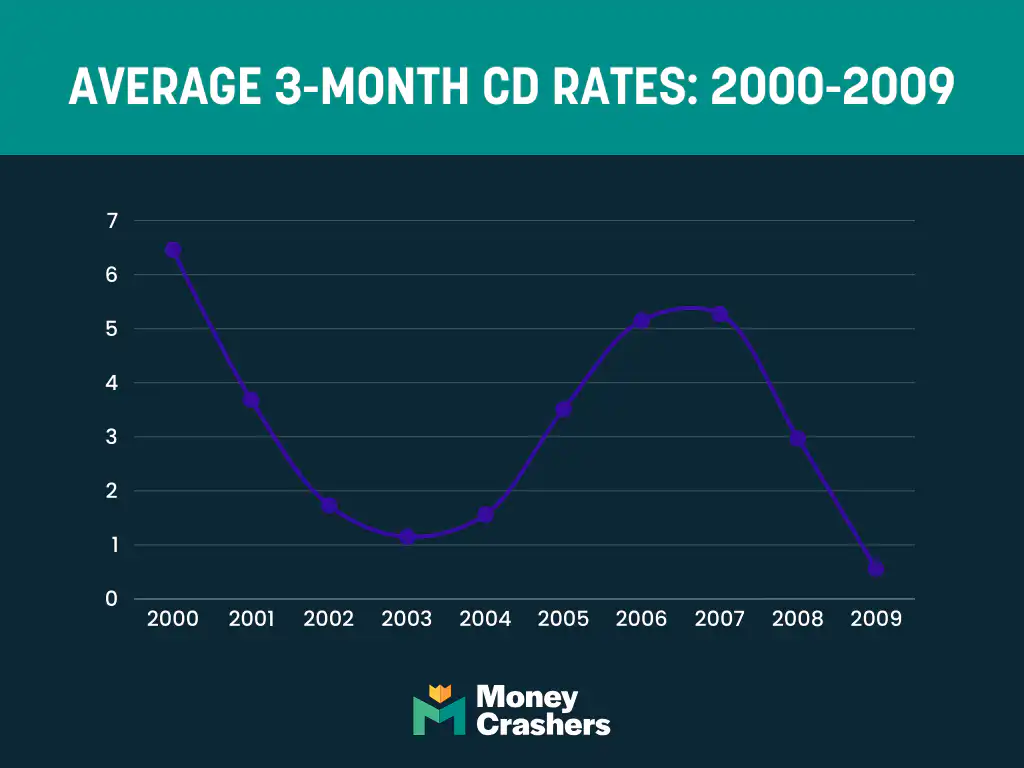
CD rates recovered in 2005 and 2006 as the economy expanded in earnest, and the Federal Reserve raised rates to slow things down.
It wouldn’t help. Unlike the productivity-driven 1990s boom, this expansion was at least partly the work of a new bubble, one that would come to dwarf the tech bubble and threaten a global depression. The Federal Reserve’s usual playbook — raising rates to prevent the economy from overheating — wasn’t up to the challenge. No one knew it yet, but a financial crisis loomed in the not-too-distant future. Short-term CD rates would flatline after touching 5% APY one more time in 2006.
The short version of the 2000s housing bubble and subsequent financial crisis is that banks hungry for profit in a low-interest-rate environment saw an opportunity in the housing market. They’d relax their underwriting standards, expanding the pool of not-so-creditworthy homebuyers they could lend to. They’d then sell those “subprime” loans to bigger banks, which would package and repackage them into synthetic financial products that very few people actually understood.
Over time, multinational banks acquired trillions of dollars of debt obligations backed by real estate. Most people — even smart finance people — thought nothing of it until all those not-so-creditworthy borrowers began to default on their loans and lose their homes. U.S. home prices flatlined, then declined, and the problem built on itself until everyone realized those trillions of dollars in synthetic debt obligations were all but worthless. By then, it was too late.
The ensuing recession was the worst since the Great Depression. It began in late 2007, and the federal funds rate was near zero within a year. Short-term CD rates followed suit.
The era of low-risk, inflation-beating savings was officially over.
Decade Close-Up: 2010 – 2019
The Great Recession lasted 18 months and ended in June 2009. But the hangover stretched well into the 2010s. The unemployment rate remained above 8% until late 2012 and above 6% until late 2014. The U-6 rate, a broader measure of job market weakness that includes people working part-time for economic reasons, remained above 10% until late 2015.
Growth of the U.S. gross domestic product, a comprehensive measure of a country’s economic activity, was positive but tepid during this period, partly held back by lackluster consumer confidence. Those fortunate enough to have full-time jobs in the early 2010s focused more on repairing their personal balance sheets — paying off debt, rebuilding their savings — than on buying new cars, upsizing their homes, and splurging on things like vacations or fancy tech.
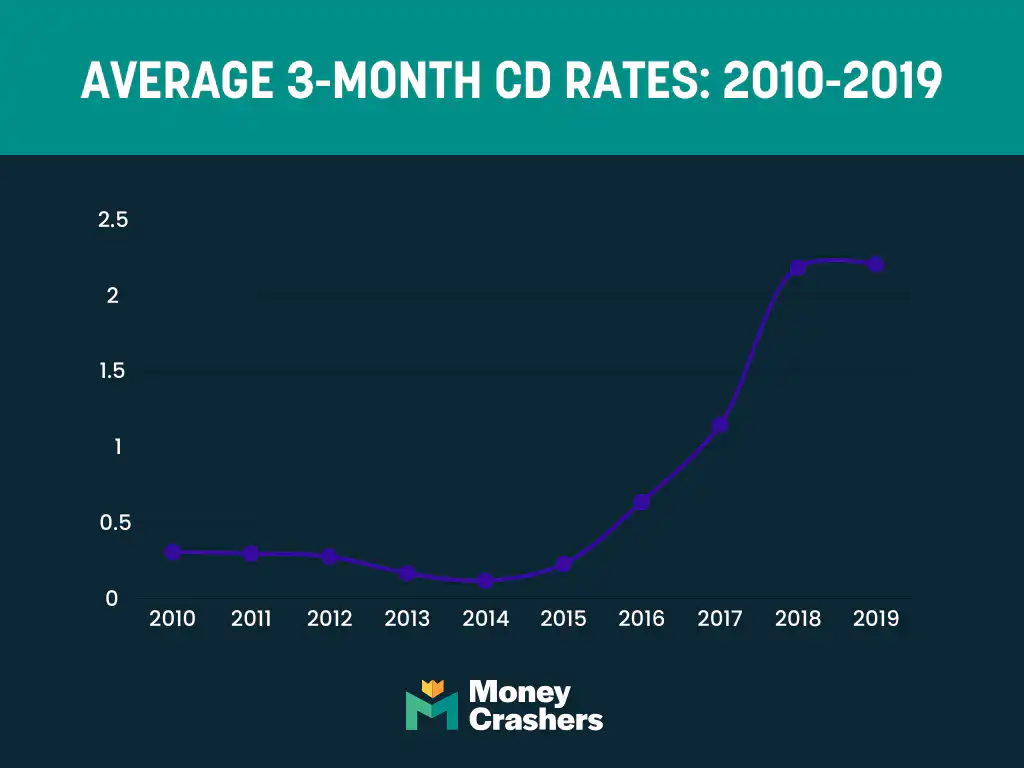
This persistent economic weakness meant the Federal Reserve was in no hurry to raise interest rates. The federal funds rate remained near zero until October 2015, holding CD rates down with it. Inflation remained in check, too, averaging 1% to 3%, but that still left savers in a hole. At 2% inflation, a three-month CD yielding 0.10% APY in nominal terms returns negative-1.90% in real terms.
Risk-tolerant savers had better options anyway. Despite (or maybe because of) the weak labor market, U.S. equity markets performed very well in the early and middle 2010s. The S&P 500 stock index nearly doubled in value between January 2010 and January 2016. If you had extra cash during this stretch, it made far more sense to park it in a stock index fund than in the bank.
Things didn’t change much in the decade’s second half, even as the labor market improved. The Federal Reserve began a slow, steady rate-hiking cycle in late 2015, topping out at 2.50% in early 2019. That pushed mortgage rates higher, but CD rates barely budged. A three-month CD paid about 0.20% APY in the first half of 2019, still well below the inflation rate.
Meanwhile, stocks continued to rise, with the S&P 500 adding another 60% or so between January 2016 and January 2020. Short-term CDs just weren’t worthwhile for any but the most risk-averse savers.
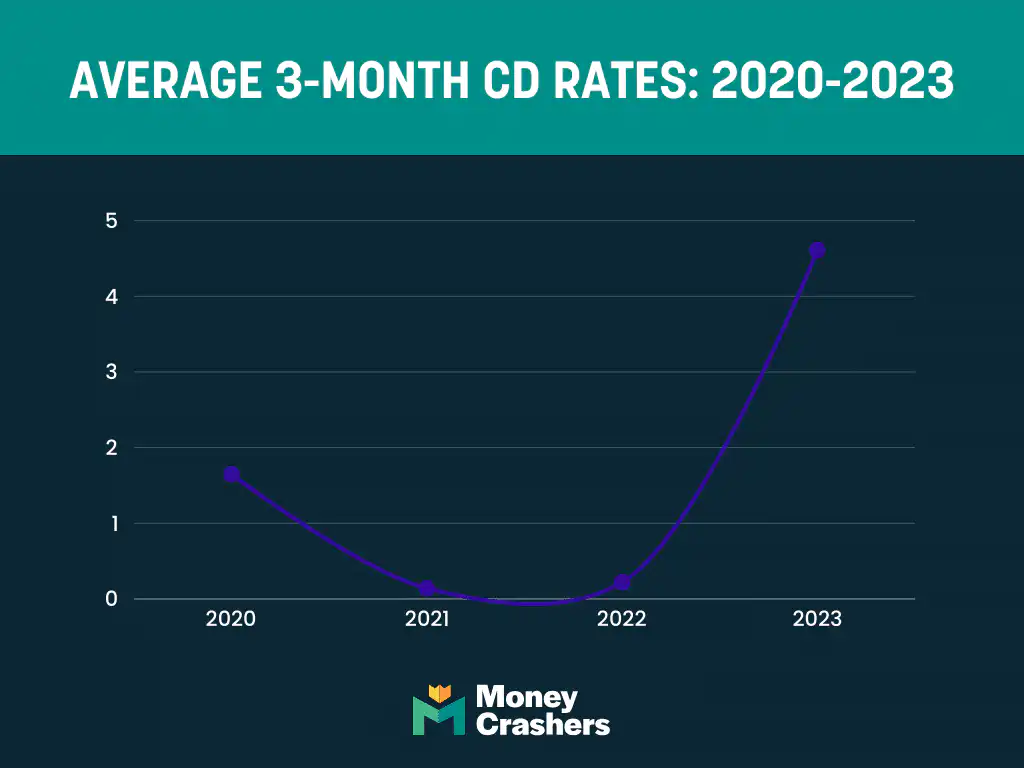
Decade Close-Up: 2020 – 2024
The 2020s opened to troubling news out of China. Something about a novel coronavirus sickening and killing hundreds, then thousands, and prompting unprecedented stay-at-home orders in the affected areas. Thus began the definitive event of the 21st century.
For a while, the outbreak seemed confined to a central Chinese city few Americans had heard of, and people in the rest of the world mostly went on with their lives. But by late February 2020, it was clear the virus wouldn’t be contained.
We all remember what happened next: In March 2020, the World Health Organization declared a global pandemic, and the global economy ground to a near-halt.
There’s no minimizing the human toll of the COVID-19 pandemic. Millions died. But from an economic perspective, the pandemic wasn’t the long-lasting catastrophe many expected initially. Central banks and governments worldwide sprang into action, slashing interest rates and authorizing trillions of dollars in economic stimulus.
Here in the United States, the Federal Reserve cut its interest rate to near zero and launched a massive government bond-buying (quantitative easing) campaign as Congress authorized the first of several rounds of stimulus. Though millions of Americans found themselves unemployed in March and April 2020, spiking the unemployment rate to levels unseen in nearly a century and sparking a brief recession, the economy didn’t collapse. By the end of 2020, more than half of those thrown out of work in the pandemic’s first weeks were back on the job.
The federal government’s aggressive moves had longer-term economic reverberations. At first, rates cratered, ushering in an unprecedented period of cheap capital. That was bad news for savers but great news for borrowers and investors. Though three-month CD rates didn’t have far to fall, rates on longer-term CDs crashed, pushing consumers flush with stimulus cash into stocks, crypto, and real estate.
As every economist knows, there’s no such thing as a free lunch — or in this case as printing trillions of dollars without throwing the economy out of whack. A crypto bubble formed and popped seemingly overnight, destroying hundreds of billions in legitimate (and not-so-legitimate) value along the way.
Housing prices got out of control, too, especially in the smaller metro markets to which city-dwellers fled early in the pandemic. While a repeat of the 2000s housing bust might not be on tap, U.S. home values appear likely to decline in real and perhaps nominal terms in 2023.
More troublingly, the COVID-19 stimulus pushed inflation rates to early-1980s levels, sparking Volcker deja vu. The Federal Reserve aggressively raised interest rates in 2022 to slow the economy and tamp down inflation. Five-year CD rates fell to less than 1%. Shorter-term CD yields continued to lag.
As the pandemic drew to a close and inflation continued to thrive, the Fed raised the Federal Reserve rate, subsequently increasing CD rates. While inflation fell from an average of 6.5% in 2022 to 3.2% in 2024, it is still considered high, and the Fed continues to battle it.
The higher Fed rates resulted in average 3-month CD rates of 5% or more. The Fed raised rates a total of 11 times from 2022 to 2023 and have yet to cut rates, although experts believe it’s coming.
Where Will CD Rates Be in 2025?
Where do CD rates go from here? From April 2024 to January 2025, we expect CD rates to go up, then level off and move sideways, and finally fall again toward pre-pandemic levels.
Chasing the Federal Funds Rate
Private banks are still chasing the federal funds rate. The Federal Reserve raised its interest rate by 75 basis points (0.75%) in November 2022 and by 50 basis points the following month. It now hovers between 5.25% and 5.50%, its highest level since November 2007.
Most Federal Reserve-watchers expect a terminal rate — the current tightening cycle’s highest rate range — of around 5.5%. Some expect it to go higher still and top out around 6%. Even the more conservative case implies further hikes totaling 75 to 100 basis points before the Federal Reserve stands down.
How Low Will CD Rates Go by 2025?
We’ll be in a holding pattern once the Federal Reserve stops tightening and CD rates peak. CD rates won’t rise or fall much for at least a couple of months, giving consumers time to load up on these relatively high-yield, low-risk savings vehicles.
How long CD rates stay near the peak depends on the state of the economy and the market’s expectations for the Federal Reserve’s next move. Economists and banks agree that we’ll see a proper recession (as defined by the National Bureau of Economic Research) in 2023.
Because it’s widely expected, the Federal Reserve won’t be caught by surprise like they were by COVID-19. But there’s still a lot of uncertainty around how quickly the labor market will turn and how badly the housing market will contract, among other factors likely to influence the recession’s length and depth. A brief, mild downturn might bring the federal funds rate down to 3% or so. A longer, more severe recession could see it approach zero once more.
We expect an outcome closer to the former than the latter: a mild recession that shaves about 1.5% off U.S. gross domestic product. For reference, GDP dipped 5.4% during the Great Recession.
In our scenario, the Federal Reserve responds by cutting rates by a total of 250 basis points over a period of 12 to 18 months. The economy is growing at a steady 1.5% annual clip, and inflation is under 3% — from a macroeconomic perspective, as good a state of affairs as the Federal Reserve could hope for. They close out 2024 with no further rate hikes or cuts.
When the dust settles on the rate-cutting cycle, the three-month CD rate hovers around 0.50% which we’ve seen mutliple times in the historical CD rates. Taking its cues from the federal funds rate as always, it remains around there for the rest of 2025.
Editorial & Advertiser Disclosure: The editorial content on this website is not provided, commissioned, reviewed, approved, or otherwise endorsed by any advertiser. Opinions expressed are ours alone, not those of any advertiser. The offers that appear are from companies from which we may receive compensation. However, this compensation does not impact where and how these companies are mentioned on the site. We do not include all companies or all available offers in the marketplace.
Related: