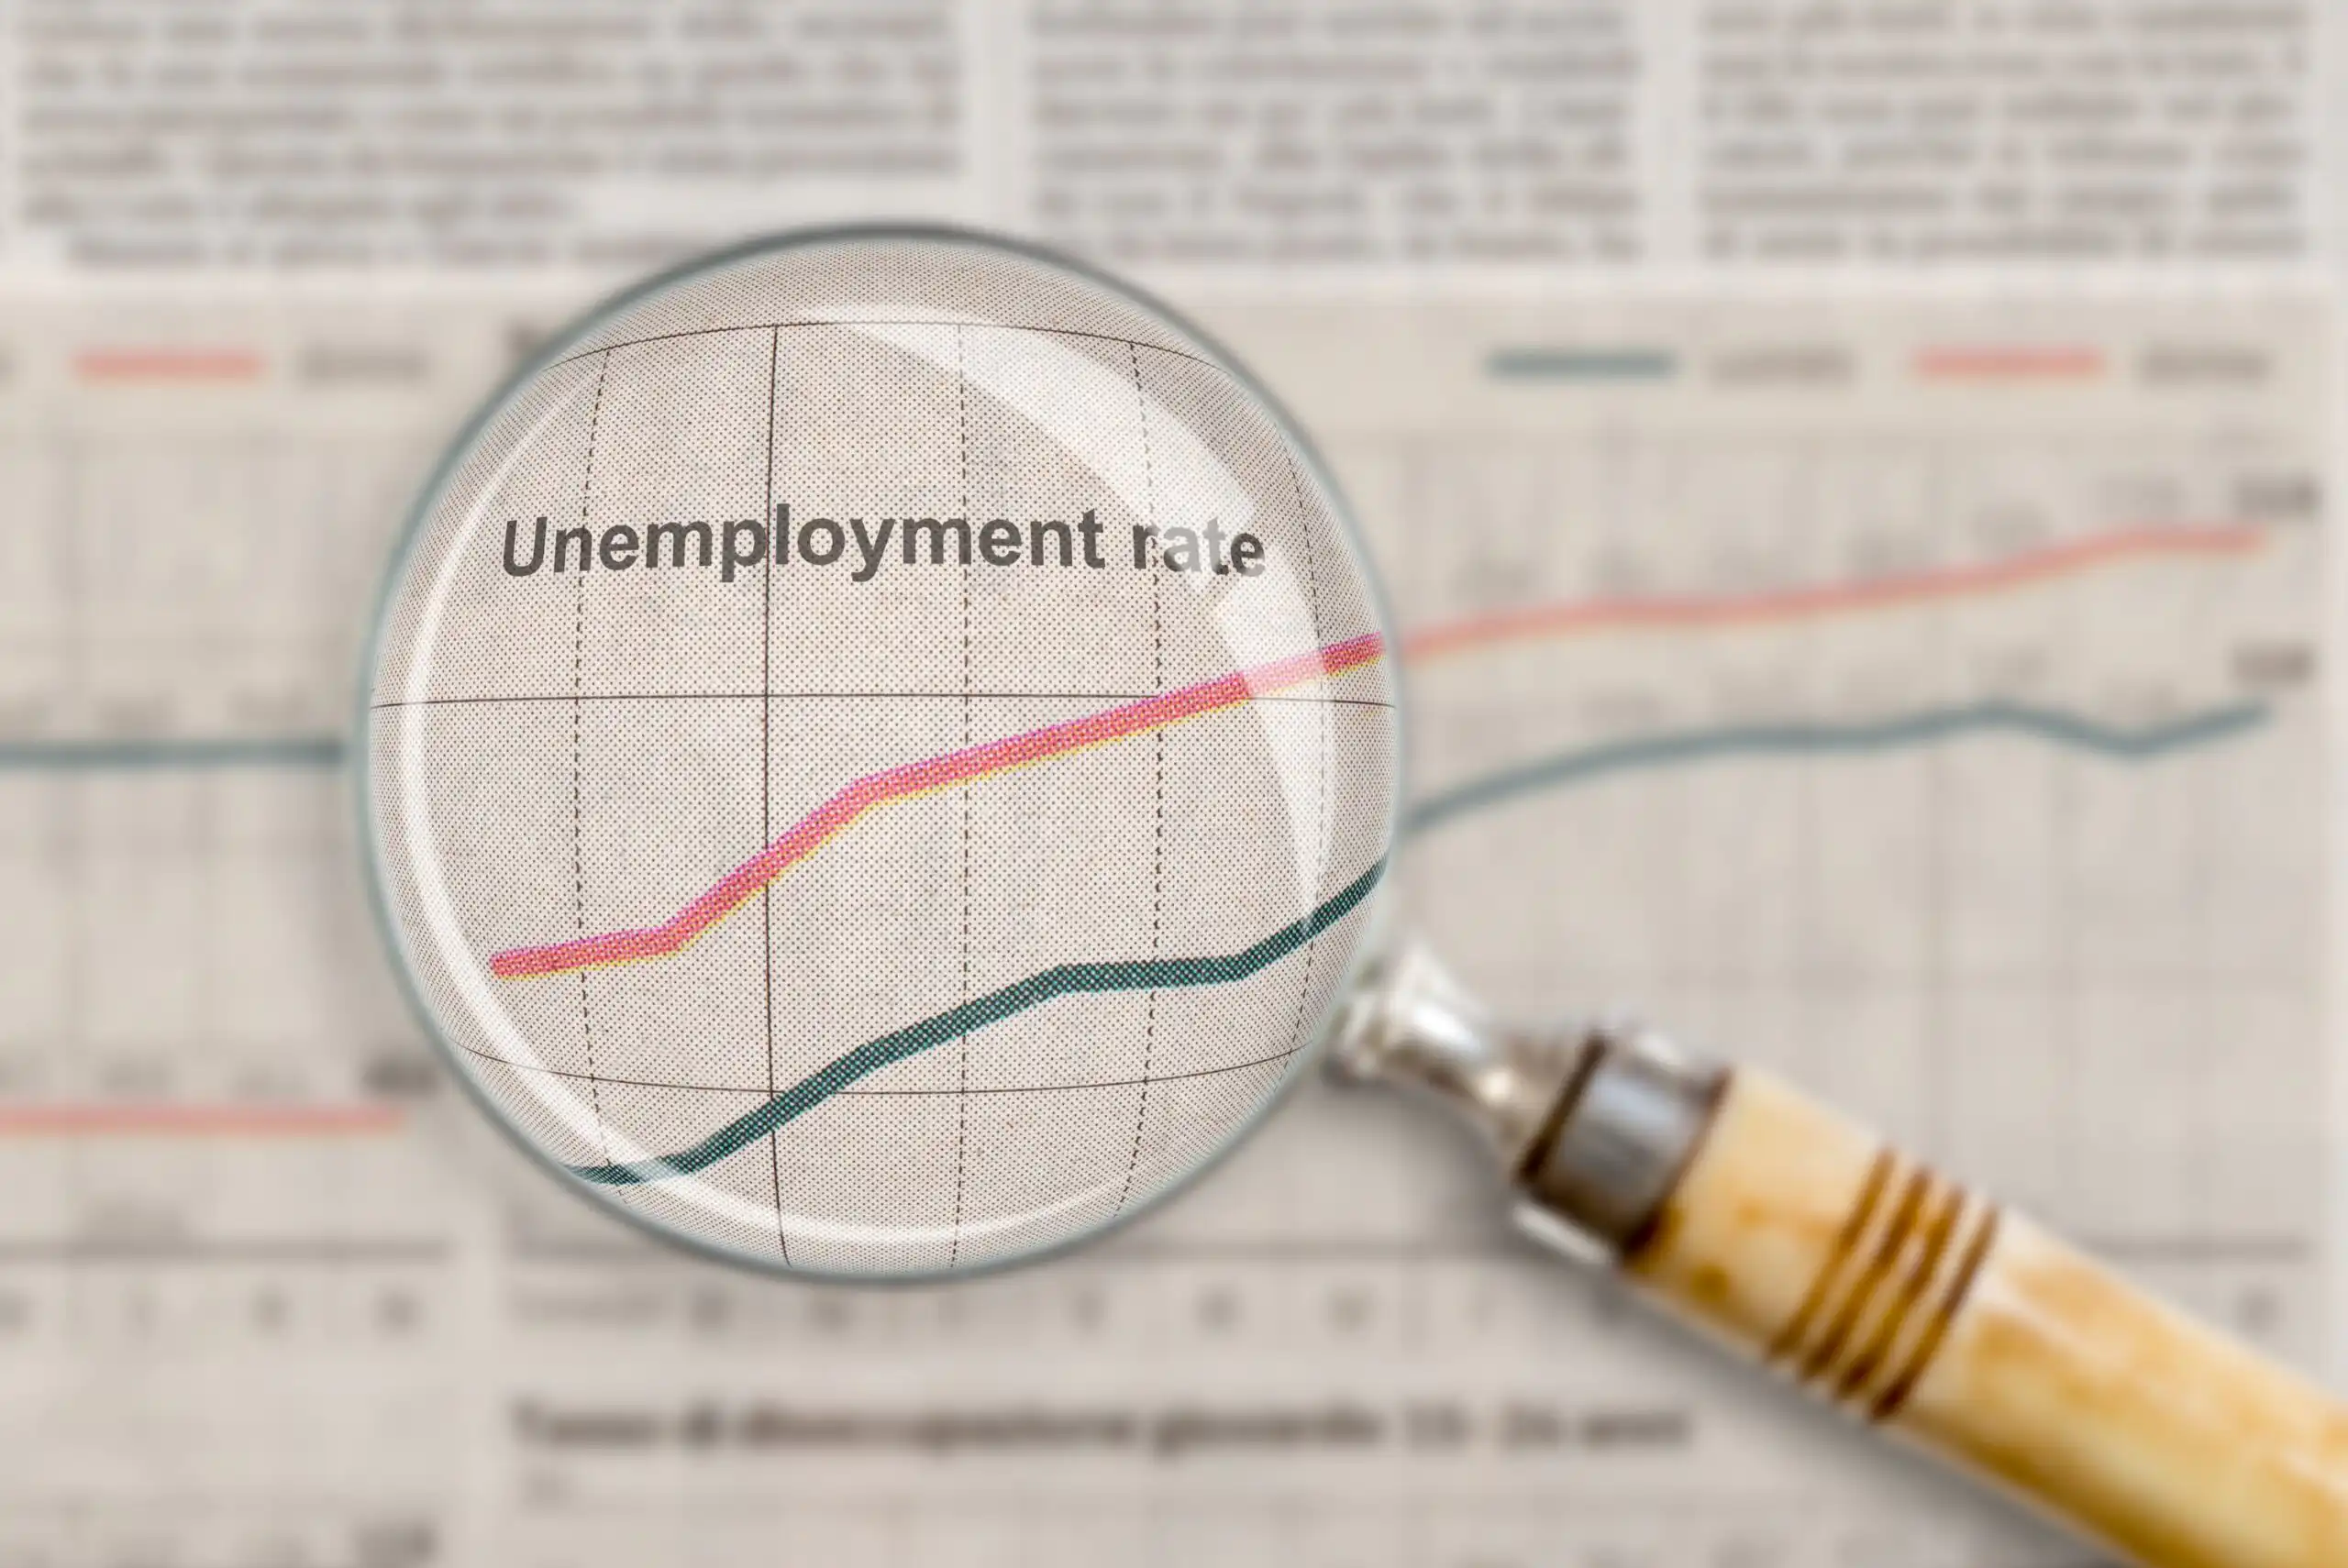
Between March and April 2020, amid the unrelenting COVID-19 pandemic, the United States’ unemployment rate shot up more than 10 percentage points to 14.7%, according to the U.S. Bureau of Labor Statistics (BLS).
The unemployment rate has since fallen closer to historical averages, but the increase in unemployment levels at the start of the pandemic was the sharpest in the history of the Department of Labor’s unemployment data series, which dates back to 1948.
The official unemployment rate reached its highest levels since the Great Depression when roughly 1 in 4 American workers were on the dole. And the labor force participation rate, the measure of working-age civilians actively working or seeking employment, dropped to its lowest level since 1973.
Yet these sobering figures could understate the extent of the pandemic-induced downturn. For years, experts have argued convincingly that the real rate of unemployment is much higher than the Department of Labor reports each month.
As is often the case with statistical measurements involving hundreds of millions of individuals operating in a dynamic environment, the reality is much more complicated than a single number can convey.
To understand the limitations of the headline unemployment rate published by the federal government each month and the flaws in the underlying calculations, we first need to understand how the Department of Labor defines and measures labor force activity.
How Is the Unemployment Rate (Jobless Rate) Calculated?
The federal government uses a reasonably straightforward (though resource-intensive) methodology to measure the number of working-age people who qualify as unemployed each month.
While this methodology has inherent flaws and fails to capture the full extent of unemployment, it establishes an important baseline for the public’s understanding of the labor market.
The Current Population Survey
The process begins with a household survey known as the Current Population Survey (CPS).
Each month, usually during the week that includes the month’s 12th day, interviewers from the Census Bureau call or visit 60,000 households containing about 110,000 individuals on average.
The interviewers ask detailed questions about each household member’s labor force participation, including whether they’re currently employed, actively seeking work, not actively seeking work, unable to work, or currently engaged in military service that precludes civilian employment. The list of questions is very detailed.
The CPS’s definitions of “employed,” “unemployed,” and “labor force participation” are clear-cut:
- Employed: A respondent who works full time or part time, even if their labor force activity is gig work or self-employment.
- Unemployed: A respondent who doesn’t have a job but has been looking for one for four weeks and is available if hired.
- Labor Force Nonparticipant: A respondent who doesn’t have a job and isn’t actively looking for one. A labor force nonparticipant reenters the labor force when they begin actively seeking employment.
Calculating the U.S. Unemployment Rate
The Census Bureau then uses the results of the CPS to calculate the official U.S. unemployment rate for the survey month.
In simple terms, you calculate the unemployment rate by dividing the number of individuals actively seeking employment (the unemployed) by the number of individuals who have jobs (the employed) plus the unemployed.
The sum of the employed plus unemployed is the total number of labor force participants. You don’t include labor force nonparticipants in the calculation.
In mathematical terms, the formula is as follows:
Total number of unemployed / (total number of employed + total number of unemployed) = unemployment rate
Here’s an example. The BLS conducts a survey of 60,000 households that yields 110,000 respondents. In their survey, they find the following results:
- Of those respondents, 60,000 have jobs. They either work for an employer or operate their own business.
- Another 10,000 say they’re looking for work.
- The remaining 40,000 are not considered part of the labor force. They may be going back to school, disabled and unable to work, or perhaps have given up looking for work because the economy is so bad. What’s most surprising is that the government completely ignores the existence of this last group when calculating the unemployment rate.
According to the gathered data, the unemployment rate in this case is 14.3%. You calculate it as follows:
10,000/(10,000+60,000) = 14.3%
The 40,000 people the government doesn’t classify as in the labor force aren’t involved in the calculation, even though this number likely includes those who need work and would gladly take a job if offered one.
To estimate the actual number of American workers who qualify as unemployed during the survey period, they scale the result up in proportion to the total U.S. population.
In reality, the need to weight responses by geographical and demographic characteristics complicates the final calculation. Those characteristics include:
- Age
- Sex
- Race
- Hispanic ethnicity
- State of residence of the person
- Residence in any of about 2,000 geographic sampling units, of which about 800 are used in any given CPS sample
This weighting, which involves complex statistical calculations, ensures a much more accurate result than an unweighted sample of 60,000 random U.S. households.
According to the BLS, which publishes the final unemployment calculations, there is a 90% chance that the estimated total number of unemployed workers, which ranges from about 7 million to 15 million during normal economic cycles, lands within about 300,000 of the actual figure.
Despite its nominal accuracy, the unemployment rate is not a perfect measurement of the overall health of the labor market.
Its most notable flaws include the fact that it intentionally leaves millions of potential workers out of the labor force and a simplistic definition of employment that fails to account for earnings, hours worked, and other measures of living wage employment.
1. The Household Survey Is a Snapshot in Time
The Census Bureau’s household unemployment survey is a monthly snapshot in time, not a continuous reading of labor market conditions.
Because it typically occurs during the week including the 12th of the month, it may not accurately reflect conditions during the opening or closing days of the month.
That isn’t a fatal flaw in normal times, but it can result in misleading data in more extraordinary periods.
For example, the official unemployment rate for March 2020 (4.4%) vastly underestimated the scale of job losses due to widespread closures of nonessential businesses during the second half of that month as the coronavirus pandemic set in.
2. Millions of People Don’t Participate in the Labor Force
As a percentage of the total population of eligible working-age individuals, the labor force participation rate has ranged from 60% to 65% for many years.
Were all labor force nonparticipants included in unemployment rate calculations, the number of officially unemployed Americans would increase by tens of millions, with the exact jump depending on actual labor force participation and size at the time.
That would significantly increase the unemployment rate.
3. The Household Survey Isn’t Guaranteed to Be Accurate
The CPS employs sophisticated statistical tools to achieve a representative snapshot of national labor market conditions using a relatively small sample size.
But these tools are no substitute for a comprehensive census of more than 100 million U.S. households, which would be prohibitively expensive and labor-intensive to run each month.
Overrepresentation or underrepresentation of particular demographic groups or geographical regions, as well as worker misclassification, can skew the results.
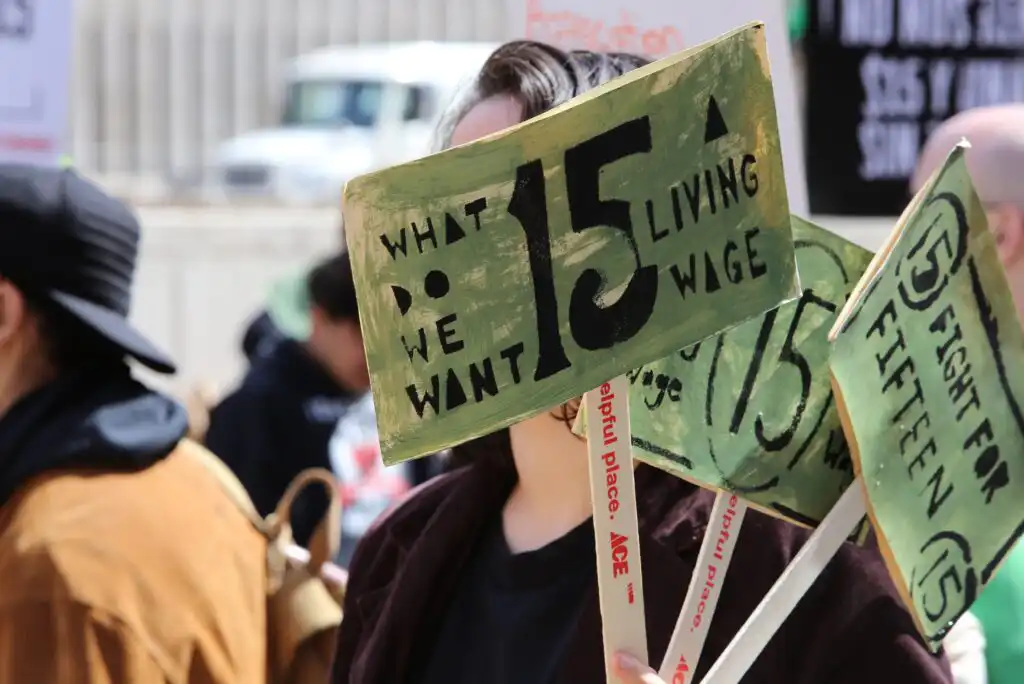
4. Not All Employed Individuals Survive Off Income From Employment
Not all workers earn enough to support themselves on income from employment alone.
Even when they earn some employment income, millions rely on financial support and housing assistance provided by parents, other relatives, spouses, charitable organizations, or government assistance programs.
These workers, who often work part time or for minimum wage, are considered underemployed.
Other full- or part-time workers, especially those in sectors like agriculture and tourism, earn significant income on a seasonal basis only and withdraw from the labor force or work sporadically during the low season.
While the BLS uses sophisticated models to smooth out seasonal labor market variations, the headline unemployment rate fails to capture seasonal employment’s nuance (and struggle).
5. Not All Workers Fall Into Neat Employment Categories
Some people fall into more than one employment category within a relatively short time frame and even within individual monthly survey periods.
For example, while students are typically left out of the workforce, a high school student who begins looking for a job becomes part of the workforce and is subsequently classified as unemployed until finding one or ceasing their search.
6. Some Workers Classified as Employed Probably Shouldn’t Be
Some workers are more secure in their employment than others.
Job insecurity (when a worker is technically still employed or engaged in an income-producing activity but might not be for very long) occurs for a variety of reasons. Some of the most common include:
- Self-employed individuals or gig economy workers forced out of business by increased competition for work or pay
- Employees placed on temporary leave pending disciplinary action likely to result in their termination
- Employees who voluntarily take job-protected leave under the Family and Medical Leave Act and subsequently become too ill or preoccupied with care duties to resume employment
- Employees and contractors of struggling businesses contemplating layoffs or liquidation, who are likely to lose their jobs soon
The actual unemployment rate is difficult enough to calculate accurately.zAchieving a complete picture of the overall strength of the labor market, to say nothing of the American workforce’s fiscal health, is significantly more challenging. There are several reasons for that.
Limitations of the Headline Unemployment Rate
Among the greatest weaknesses of the headline unemployment rate is its subjectivity. Although the Census Bureau and BLS have definitive answers for each of the following questions about the unemployment rate, they aren’t ironclad.
Instead, they’re products of a deliberative process that could have very easily produced different results.
- Should we count someone as unemployed if they want a job but aren’t looking for one?
- Should we count someone who is able but unwilling to work as unemployed instead of as a labor force nonparticipant?
- Should we classify disabled citizens who can’t work as unemployed?
- Should we classify self-employed people as unemployed if they have no income?
- Should unemployment rate calculations include high school students, whose labor force participation has declined as cultural emphasis on college preparation has increased and entry-level jobs requiring no experience have declined?
- Should eligibility for unemployment benefits have any bearing on whether someone is considered unemployed?
- Should we count temporarily furloughed or laid-off employees as unemployed when their employers have promised to rehire them?
- Should we count unpaid family workers who work legally for family-owned businesses (often agricultural businesses or businesses run by self-employed solopreneurs) without pay as employed?
Alternatives and Supplements to the Headline Unemployment Rate
The headline unemployment rate produced by the CPS is just one measure of the relative strength or weakness of the labor market. As we’ve seen, it’s not exactly nuanced.
Fortunately, many other federal and state measures of labor market activity exist. There are multiple well-known and useful alternatives and supplements to the monthly unemployment rate.
The Current Employment Statistics Program
Also known as the payroll survey or establishment survey, the Current Employment Statistics program (CES) surveys nearly 150,000 private businesses and government agencies across nearly 700,000 worksites.
It’s responsible for producing the weekly nonfarm payrolls number, a metric of labor market conditions closely watched by investors and policymakers.
CES-derived payroll figures are more volatile than the CPS-derived unemployment rate. They’re prone to double-counting workers (as millions of part-time workers engage in multiple income-producing activities, be they part-time jobs or side hustles).
But they’re a useful measurement of labor market trends, with consecutive weeks of declining or flat payrolls signaling weakness and consistent payroll increases signaling strength.
State Unemployment Programs
States generally measure internal unemployment by summing up the number of labor force participants currently receiving unemployment benefits. It’s a good measure of unemployed workers who don’t expect to be rehired by their former employers.
But since unemployment benefits are temporary, it’s an imperfect means of measuring the ranks of long-term unemployed, who continue to look for work after their eligibility for benefits expires.
Labor Force Participation Rate
The labor force participation rate measures the share of the total U.S. working-age population currently engaged in the labor market (either employed or actively looking for work).
Since 1948, labor force participation has ranged in a narrow band between about 58% and 67%, so small changes presage significant changes in the labor market.
Generally, higher labor force participation rates signal employee confidence in the strength of the labor market.
Underemployment (U-6 Rate)
The BLS’s measure of underemployment is quite a mouthful: “total unemployed, plus all persons marginally attached to the labor force, plus total employed part time for economic reasons, as a percent of the civilian labor force plus all persons marginally attached to the labor force.”
Informally, it’s known as the U-6 rate.
The BLS defines “persons marginally attached to the labor force” as those neither working nor looking for work but who are willing to work, able to work, and have looked for work within the past 12 months. Workers employed part time for economic reasons are workers who settle for part-time employment because they’re unable to find full-time work.
Because it’s consistently several percentage points higher than the U-3 rate, the U-6 rate is a far more comprehensive measure of labor market weakness. It has a plausible claim to the elusive title of “real unemployment rate.”
It’s easy to see how the headline unemployment rate produced by the CPS can be misleading. In moments of candor, even the hardworking professionals responsible for producing it each month would tell you that it’s far from perfect for measuring the overall state of the U.S. labor market, let alone the broader U.S. economy.
Fortunately, the headline unemployment rate isn’t the only available measure of labor market strength or weakness. Overall labor force participation, underemployment, wage growth, payrolls, and state-level data add valuable nuance to the picture.
But even these metrics can’t tell us much about what it’s like to be employed. And if you’re among the millions of newly unemployed Americans struggling to find work in the wake of the coronavirus pandemic, you’re probably less focused on statistics and more focused on opportunities to make the best use of your unemployment.
Editorial & Advertiser Disclosure: The editorial content on this website is not provided, commissioned, reviewed, approved, or otherwise endorsed by any advertiser. Opinions expressed are ours alone, not those of any advertiser. The offers that appear are from companies from which we may receive compensation. However, this compensation does not impact where and how these companies are mentioned on the site. We do not include all companies or all available offers in the marketplace.
Related: